
Page 41 - ICJ Jan 2023
P. 41
TECHNICAL PAPER COLLECTOR’S EDITION
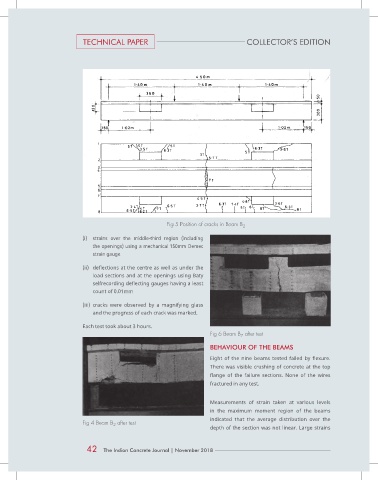
Fig 5 Position of cracks in Beam B 2
(i) strains over the middle-third region (including
the openings) using a mechanical 150mm Demec
strain gauge
(ii) deflections at the centre as well as under the
load sections and at the openings using Baty
selfrecording deflecting gauges having a least
count of 0.01mm
(iii) cracks were observed by a magnifying glass
and the progress of each crack was marked.
Each test took about 3 hours.
Fig 6 Beam B after test
7
BEHAVIOUR OF THE BEAMS
Eight of the nine beams tested failed by flexure.
There was visible crushing of concrete at the top
flange of the failure sections. None of the wires
fractured in any test.
Measurements of strain taken at various levels
in the maximum moment region of the beams
indicated that the average distribution over the
Fig 4 Beam B after test
2
depth of the section was not linear. Large strains
42 The Indian Concrete Journal | November 2018