
Page 5 - Open-Access-Dec-2019
P. 5
TECHNICAL PAPER
Damage pattern of cover material and mass loss and mass 2.2 Specimen Preparation
loss rate of the steel reinforcing bar after different duration of
corrosion were reported. Residual flexural strength and failure The solid ingredients including cement, GGBS and sand were
mode of corroded reinforced ECC and FRC prism specimens dry-mixed first for 3 min. Water and superplasticizer were then
were examined. added in the mixture and mixed for another 3 min. PVA fibres
were then slowly added in the fresh mixture and mixed for 5-8
min to ensure good fibre dispersion without balling. The fresh
2. ExPERIMENTAL PRoCEDURE
mixtures were cast into different molds for the preparation of
2.1 Materials and Mix Proportions cubic (50 mm), dog-bone (12 × 50 × 100 mm in the gauge length
Raw materials used to prepare ECC and FRCs were Ordinary area) and reinforced prism specimens (50 × 75 × 275 mm). The
Portland Cement (OPC), ground granulated blast-furnace slag steel reinforcement with a diameter of 13 mm was coated at
(GGBS), fine river sand (particle size smaller than 0.6 mm), water, two ends with epoxy resin. The uncoated part embedded in the
superplasticizer (SP) and polyvinyl alcohol (PVA) fibres. Chemical middle of the prism was 240 mm. The steel reinforcement was
compositions of cement and GGBS are presented in Table 1. placed off-center in the prism with a cover thickness of 25 mm to
Mechanical and geometrical properties of PVA fibres are listed the bottom surface. After demolding, the cubic and dog-bone
in Table 2. An ECC mix and three FRC mixes were prepared and specimens were cured in laboratory air for 28 d before testing.
mix proportions of the four mixes are summarized in Table 3. As The reinforced prism specimens were cured in laboratory air for
can be seen, all four mixes had the same matrix composition but 21 d followed by water curing for 7 d. The water curing was to
with different fibre dosage. This design was to ensure all four ensure saturation of water in capillary pores of specimens before
mixes have comparable matrix properties and the increased the corrosion test.
fibre dosage was used to alter the tensile performance of the
cover material. Thus, change of corrosion performance (if any) 2.3 Test Methods
was not attributed to matrix properties; rather it was a result of
tensile properties of the cover material. The binder consisted of For each mix, three cubes and four dog-bone specimens
40 % OPC and 60% GGBS with a water-to-binder of 0.27 and a were used to determine the compressive strength and tensile
sand-to-binder ratio of 0.2. stress versus strain (or crack opening) behavior, respectively.
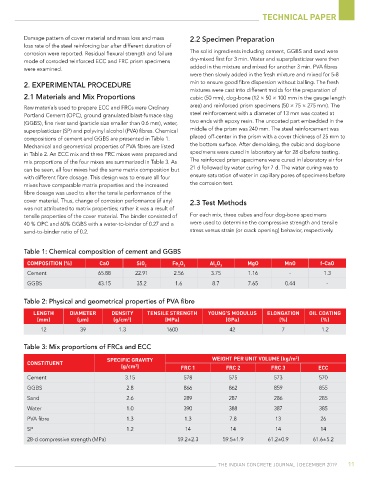
Table 1: Chemical composition of cement and GGBS
CoMposition (%) Cao sio 2 fe 2 o 3 al 2 o 3 Mgo Mno f-Cao
Cement 65.88 22.91 2.56 3.75 1.16 - 1.3
GGBS 43.15 35.2 1.6 8.7 7.65 0.44 -
Table 2: Physical and geometrical properties of PVA fibre
Length DiaMeter DensitY tensiLe strength Young’s MoDuLus eLongation oiL Coating
(mm) (μm) (g/cm ) (Mpa) (gpa) (%) (%)
3
12 39 1.3 1600 42 7 1.2
Table 3: Mix proportions of FRCs and ECC
3
speCifiC gravitY Weight per unit voLuMe (kg/m )
Constituent
(g/cm ) frC 1 frC 2 frC 3 eCC
3
Cement 3.15 578 575 573 570
GGBS 2.8 866 862 859 855
Sand 2.6 289 287 286 285
Water 1.0 390 388 387 385
PVA fibre 1.3 1.3 7.8 13 26
SP 1.2 14 14 14 14
28-d compressive strength (MPa) 59.2±2.3 59.5±1.9 61.2±0.9 61.6±5.2
The IndIan ConCreTe Journal | deCember 2019 11