Page 6 - Open-Access-Dec-2019
P. 6

TECHNICAL PAPER


         Displacement-controlled uniaxial tensile tests were conducted   3. RESULTS AND DISCUSSIoN
         on dog-bone specimens with an Instron 5569 universal testing
         machine. The loading rate of the tensile test was 0.2 mm/min.   3.1 Mechanical Properties of Cover Materials
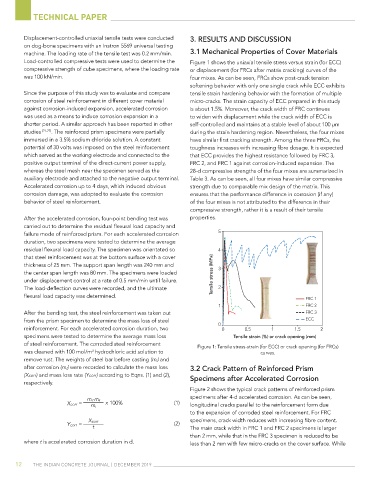
         Load-controlled compressive tests were used to determine the   Figure 1 shows the uniaxial tensile stress versus strain (for ECC)
         compressive strength of cube specimens, where the loading rate   or displacement (for FRCs after matrix cracking) curves of the
         was 100 kN/min.                                        four mixes. As can be seen, FRCs show post-crack tension
                                                                softening behavior with only one single crack while ECC exhibits
         Since the purpose of this study was to evaluate and compare   tensile strain hardening behavior with the formation of multiple
         corrosion of steel reinforcement in different cover material   micro-cracks. The strain capacity of ECC prepared in this study
         against corrosion-induced expansion, accelerated corrosion   is about 1.5%. Moreover, the crack width of FRC continues
         was used as a means to induce corrosion expansion in a   to widen with displacement while the crack width of ECC is
         shorter period. A similar approach has been reported in other   self-controlled and maintains at a stable level of about 100 μm
         studies  [21-27] . The reinforced prism specimens were partially   during the strain hardening region. Nevertheless, the four mixes
         immersed in a 3.5% sodium chloride solution. A constant   have similar first cracking strength. Among the three FRCs, the
         potential of 30 volts was imposed on the steel reinforcement   toughness increases with increasing fibre dosage. It is expected
         which served as the working electrode and connected to the   that ECC provides the highest resistance followed by FRC 3,
         positive output terminal of the direct-current power supply,   FRC 2, and FRC 1 against corrosion-induced expansion. The
         whereas the steel mesh near the specimen served as the   28-d compressive strengths of the four mixes are summarized in
         auxiliary electrode and attached to the negative output terminal.   Table 3. As can be seen, all four mixes have similar compressive
         Accelerated corrosion up to 4 days, which induced obvious   strength due to comparable mix design of the matrix. This
         corrosion damage, was adopted to evaluate the corrosion   ensures that the performance difference in corrosion (if any)
         behavior of steel reinforcement.                       of the four mixes is not attributed to the difference in their
                                                                compressive strength, rather it is a result of their tensile
         After the accelerated corrosion, four-point bending test was   properties.
         carried out to determine the residual flexural load capacity and
         failure mode of reinforced prism. For each accelerated corrosion
         duration, two specimens were tested to determine the average                                                                                                      F                                                               F
         residual flexural load capacity. The specimen was orientated so                                                                                                   F                                                               F
         that steel reinforcement was at the bottom surface with a cover                                                                                                   F                            Óx                                 F
                                                                                                                                                                                                                                           F
         thickness of 25 mm. The support span length was 240 mm and                                                                                                        F
         the center span length was 80 mm. The specimens were loaded   /i˜Ãˆi ÃÌÀiÃà ­ *>®                                                                                                             Óä
         under displacement control at a rate of 0.5 mm/min until failure.
         The load-deflection curves were recorded, and the ultimate                                                                     >Ãà œÃà ­¯®                                                    >Ãà œÃà ­¯®  £x
         flexural load capacity was determined.
                                                                                                      (4%                                                                                               £ä

                                                                                                      (4%
         After the bending test, the steel reinforcement was taken out                                (4%
         from the prism specimen to determine the mass loss of steel                                  '%%
         reinforcement. For each accelerated corrosion duration, two
         specimens were tested to determine the average mass loss             /i˜Ãˆi ÃÌÀ>ˆ˜ ­¯® œÀ VÀ>VŽ œ«i˜ˆ˜} ­““®                         ,  £    ,  Ó    ,  Î                                                     ˆLiÀ `œÃ>}i ­¯®
         of steel reinforcement. The corroded steel reinforcement   Figure 1: Tensile stress-strain (for ECC) or crack opening (for FRCs)
         was cleaned with 100 mol/m  hydrochloric acid solution to                     curves.
                               3
         remove rust. The weights of steel bar before casting (m i) and

         after corrosion (m f) were recorded to calculate the mass loss   3.2 Crack Pattern of Reinforced Prism
                                                                                  (4%
         (Xcorr) and mass loss rate (Ycorr) according to Eqns. (1) and (2),       (4%                                                                                         F                                                       (4%
         respectively.                                          Specimens after Accelerated Corrosion                                                                         F                      ®                                (4%
                                                                       ®
                                                                       Þ
                                                                                                                                                                                                                                      (4%

                                                                                  (4%
                                                                       >
                                                                Figure 2 shows the typical crack patterns of reinforced prism           ®  Þ  >                               F
                                                                       `

                                                                       À  i                                                             `                                     F                      Ž  ­                             '%%
                                                                                  '%%
                                                                specimens after 4-d accelerated corrosion. As can be seen,                 À  i                                                      Þ  Ì

                                                                       «

                       Xcorr =  m i-m f  x 100%            (1)  longitudinal cracks parallel to the reinforcement form due              «                                                            ˆ  V  >
                                                                       ¯
                               m i                                     ­     i                                                          ¯                                                            «                            ä°äÈxÝ
                                                                       Ì
                                                                to the expansion of corroded steel reinforcement. For FRC               ­     i                                                      >  V                Þ r ÓȰ™Îni
                                                                       >
                                                                          À  à                                                          Ì  >  À                                                      `  >                  ,Ô r 䰙ÎÎx
                                                                specimens, crack width reduces with increasing fibre content.

                                                                       Ã
                       Ycorr =  Xcorr                      (2)  The main crack width in FRC 1 and FRC 2 specimens is larger                à  à  œ                                                   œ         >
                                                                       œ
                                t
                                                                       

                                                                       >  à  à                                                               à                                                      À  Õ
                                                                than 2 mm, while that in the FRC 3 specimen is reduced to be            Ã  >                                                         Ý  i

         where t is accelerated corrosion duration in d.        less than 2 mm with few micro-cracks on the cover surface. While                                                                     


      12    The IndIan ConCreTe Journal | deCember 2019
                                                                                ÕÀ>̈œ˜ œv >VViiÀ>Ìi` VœÀÀœÃˆœ˜ ­`>Þî                        ,  £     ,  Ó     ,  Î                                          >Ãà œÃà œv ÃÌii Àiˆ˜vœÀVi“i˜Ì ­¯®

                                                                                  (4%                                                              (4%                                                          (4%
                                                                                  (4%                                                              (4%                                                          (4%
                                                                                  (4%                                                              (4%                                                          (4%
                                                                                                                                                                                                                '%%
                                                                                  '%%                                                              '%%

                                                                          œ>` ­Ž ®                                                        œ>` ­Ž ®                                                     œ>` ­Ž ®


                                                                                         iviV̈œ˜ ­““®                                                   iviV̈œ˜ ­““®                                              iviV̈œ˜ ­““®
   1   2   3   4   5   6   7   8   9   10   11