
Page 32 - ICJ Jan 2026
P. 32
TECHNICAL PAPER
the phase of prolonged drying beyond wet spell. During this Table 22: Reduced moisture content intervals
period, a substantial quantity of imbibed rainwater would be conducive for corrosion
lost due to evaporation. A comprehensive statistical analysis TEMPERATURE UL LL UL LL UL LL
was performed by Sarkar [66,70-71,81] and statistical distribution of w/c = 0.6 w/c = 0.5 w/c = 0.4
exposure conditions were determined. A sensitivity analysis
20 °C 0.476 0.141 0.615 0.225 0.694 0.534
was also carried out through numerical simulation for various
percentile values. Table 21 shows rain fall intensity, WDR and 40 °C 0.444 0.132 0.588 0.207 0.690 0.515
rainfall duration for five stations for 95 %, 50 % and 5 % values Note: UL and LL denote reduced equilibrium moisture contents for 90
used for numerical simulation. More details are available in and 60 % RH within concrete.
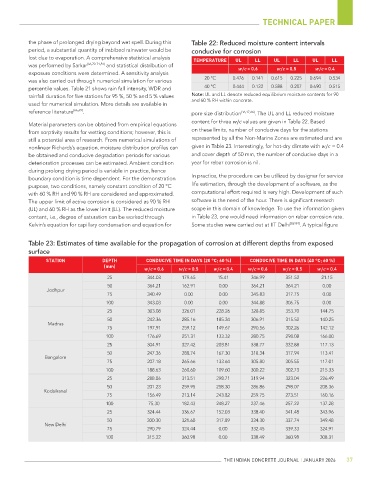
reference literature [66,69] . pore size distribution [16,17,66] . The UL and LL reduced moisture
content for three w/c values are given in Table 22. Based
Material parameters can be obtained from empirical equations
from sorptivity results for wetting conditions; however, this is on these limits, number of conducive days for the stations
still a potential area of research. From numerical simulations of represented by all the Non-Marine Zones are estimated and are
nonlinear Richards’s equation, moisture distribution profiles can given in Table 23. Interestingly, for hot-dry climate with w/c = 0.4
be obtained and conducive degradation periods for various and cover depth of 50 mm, the number of conducive days in a
deterioration processes can be estimated. Ambient condition year for rebar corrosion is nil.
during prolong drying period is variable in practice, hence
boundary condition is time dependent. For the demonstration In practice, the procedure can be utilized by designer for service
purpose, two conditions, namely constant condition of 20 °C life estimation, through the development of a software, as the
with 60 % RH and 90 % RH are considered and approximated. computational effort required is very high. Development of such
The upper limit of active corrosion is considered as 90 % RH software is the need of the hour. There is significant research
(UL) and 60 % RH as the lower limit (LL). The reduced moisture scope in this domain of knowledge. To use the information given
content, i.e., degree of saturation can be worked through in Table 23, one would need information on rebar corrosion rate.
Kelvin’s equation for capillary condensation and equation for Some studies were carried out at IIT Delhi [82-84] . A typical figure
Table 23: Estimates of time available for the propagation of corrosion at different depths from exposed
surface
STATION DEPTH CONDUCIVE TIME IN DAYS (20 °C; 60 %) CONDUCIVE TIME IN DAYS (40 °C; 60 %)
(mm) w/c = 0.6 w/c = 0.5 w/c = 0.4 w/c = 0.6 w/c = 0.5 w/c = 0.4
25 344.03 179.65 15.41 346.99 351.52 21.15
50 364.21 162.91 0.00 364.21 364.21 0.00
Jodhpur
75 340.49 0.00 0.00 345.83 317.75 0.00
100 343.03 0.00 0.00 344.88 306.75 0.00
25 303.08 326.01 228.26 328.85 353.70 144.75
50 242.36 285.16 185.34 306.91 315.52 140.25
Madras
75 197.91 259.12 149.67 290.56 302.26 142.12
100 176.69 251.31 133.32 280.75 298.08 166.00
25 304.91 327.42 203.81 338.77 332.88 117.13
50 247.36 288.74 167.30 318.34 317.94 113.41
Bangalore
75 207.18 265.66 133.64 305.80 305.55 117.01
100 188.63 260.60 109.60 300.22 302.73 215.33
25 288.06 313.51 298.71 319.94 323.04 226.49
50 201.23 259.95 258.30 286.86 298.07 208.36
Kodaikanal
75 156.49 213.14 243.82 259.75 273.51 160.16
100 75.30 182.43 248.27 237.46 257.22 137.28
25 324.44 336.67 152.03 338.40 341.48 343.96
50 300.30 321.60 317.89 334.30 337.74 349.48
New Delhi
75 290.79 324.44 0.00 332.45 339.33 324.91
100 315.32 360.98 0.00 338.49 360.98 308.31
THE INDIAN CONCRETE JOURNAL | JANUARY 2026 37