
Page 33 - ICJ Jan 2026
P. 33
TECHNICAL PAPER
Cement type
PPC
14 PSC
OPC
PPC
12 PSC
OPC
10 y(PPC) = 10.149x + 2.0706
Icorr (µA/cm 2 ) 8 6 y(PSC) = 14.425x + 2.3361
R = 0.986
R = 0.959
4
y(OPC) = 20.884x + 2.177
2 R = 0.942
0
0 0.1 0.2 0.3 0.4 0.5
Free chloride concentration (%)
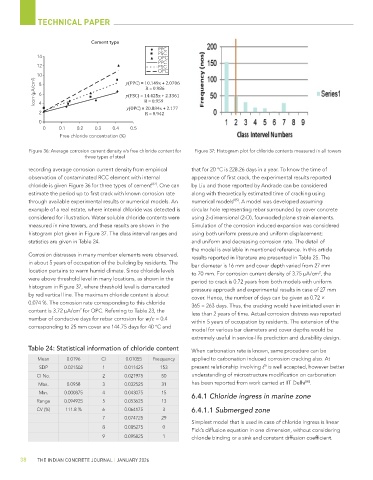
Figure 36: Average corrosion current density v/s free chloride content for Figure 37: Histogram plot for chloride contents measured in all towers
three types of steel
recording average corrosion current density from empirical that for 20 °C is 228.26 days in a year. To know the time of
observation of contaminated RCC element with internal appearance of first crack, the experimental results reported
[82]
chloride is given Figure 36 for three types of cement . One can by Liu and those reported by Andrade can be considered
estimate the period up to first crack with known corrosion rate along with theoretically estimated time of cracking using
[85]
through available experimental results or numerical models. An numerical models . A model was developed assuming
example of a real estate, where internal chloride was detected is circular hole representing rebar surrounded by cover concrete
considered for illustration. Water soluble chloride contents were using 2-dimensional (2-D), four-noded plane strain elements.
measured in nine towers, and these results are shown in the Simulation of the corrosion induced expansion was considered
histogram plot given in Figure 37. The class interval ranges and using both uniform pressure and uniform displacement;
statistics are given in Table 24. and uniform and decreasing corrosion rate. The detail of
the model is available in mentioned reference. In this article
Corrosion distresses in many member elements were observed, results reported in literature are presented in Table 25. The
in about 5 years of occupation of the building by residents. The bar diameter is 16 mm and cover depth varied from 27 mm
location pertains to warm humid climate. Since chloride levels to 70 mm. For corrosion current density of 3.75 mA/cm , the
2
were above threshold level in many locations, as shown in the period to crack is 0.72 years from both models with uniform
histogram in Figure 37, where threshold level is demarcated pressure approach and experimental results in case of 27 mm
by red vertical line. The maximum chloride content is about cover. Hence, the number of days can be given as 0.72 ×
0.074 %. The corrosion rate corresponding to this chloride 365 = 263 days. Thus, the cracking would have initiated even in
content is 3.72 mA/cm for OPC. Referring to Table 23, the less than 2 years of time. Actual corrosion distress was reported
2
number of conducive days for rebar corrosion for w/c = 0.4 within 5 years of occupation by residents. The extension of the
corresponding to 25 mm cover are 144.75 days for 40 °C and model for various bar diameters and cover depths would be
extremely useful in service-life prediction and durability design.
Table 24: Statistical information of chloride content When carbonation rate is known, same procedure can be
Mean 0.0196 CI 0.01055 Frequency applied to carbonation induced corrosion cracking also. At
½
SDP 0.021502 1 0.011425 153 present relationship involving t is well accepted, however better
CI No. 2 0.021975 50 understanding of microstructure modification on carbonation
[86]
Max. 0.0958 3 0.032525 31 has been reported from work carried at IIT Delhi .
Min. 0.000875 4 0.043075 15 6.4.1 Chloride ingress in marine zone
Range 0.094925 5 0.053625 13
CV (%) 111.8 % 6 0.064175 3 6.4.1.1 Submerged zone
7 0.074725 29
Simplest model that is used in case of chloride ingress is linear
8 0.085275 0
Fick’s diffusion equation in one dimension, without considering
9 0.095825 1 chloride binding or a sink and constant diffusion coefficient.
38 THE INDIAN CONCRETE JOURNAL | JANUARY 2026