
Page 11 - ICJ Feb Openaccess 2026
P. 11
TECHNICAL PAPER
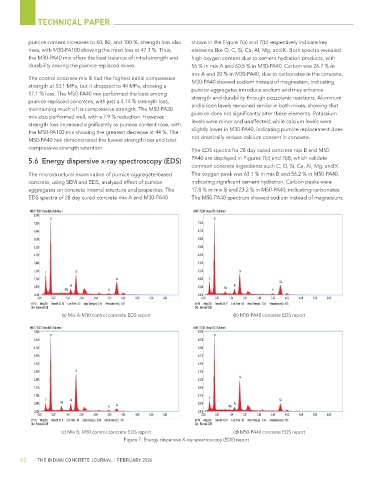
pumice content increases to 60, 80, and 100 %, strength loss also shown in the Figure 7(a) and 7(b) respectively indicate key
rises, with M30-PA100 showing the most loss at 47.1 %. Thus, elements like O, C, Si, Ca, Al, Mg, and K. Both spectra revealed
the M30-PA40 mix offers the best balance of initial strength and high oxygen content due to cement hydration products, with
durability among the pumice-replaced mixes. 56 % in mix A and 60.5 % in M30-PA40. Carbon was 26.7 % in
mix A and 20 % in M30-PA40, due to carbonates in the concrete.
The control concrete mix B had the highest initial compressive M30-PA40 showed sodium instead of magnesium, indicating
strength at 53.1 MPa, but it dropped to 44 MPa, showing a
17.1 % loss. The M50-PA40 mix performed the best among pumice aggregates introduce sodium and may enhance
pumice-replaced concretes, with just a 4.14 % strength loss, strength and durability through pozzolanic reactions. Aluminum
maintaining much of its compressive strength. The M50-PA20 and silicon levels remained similar in both mixes, showing that
mix also performed well, with a 7.9 % reduction. However, pumice does not significantly alter these elements. Potassium
strength loss increased significantly as pumice content rose, with levels were minor and unaffected, while calcium levels were
the M50-PA100 mix showing the greatest decrease at 44 %. The slightly lower in M30-PA40, indicating pumice replacement does
M50-PA40 mix demonstrated the lowest strength loss and best not drastically reduce calcium content in concrete.
compressive strength retention. The EDS spectra for 28 day cured concrete mix B and M50-
PA40 are displayed in Figures 7(c) and 7(d), which validate
5.6 Energy dispersive x-ray spectroscopy (EDS)
common concrete ingredients such C, O, Si, Ca, Al, Mg, and K.
The microstructural examination of pumice aggregate-based The oxygen peak was 63.1 % in mix B and 56.2 % in M50-PA40,
concrete, using SEM and EDS, analyzed effect of pumice indicating significant cement hydration. Carbon peaks were
aggregates on concrete internal structure and properties. The 17.8 % in mix B and 23.2 % in M50-PA40, indicating carbonates.
EDS spectra of 28 day cured concrete mix A and M30-PA40 The M50-PA40 spectrum showed sodium instead of magnesium,
(a) Mix A-M30 control concrete EDS report (b) M30-PA40 concrete EDS report
(c) Mix B, M50 control concrete EDS report (d) M50-PA40 concrete EDS report
Figure 7: Energy-dispersive X-ray spectroscopy (EDS) report
62 THE INDIAN CONCRETE JOURNAL | FEBRUARY 2026