
Page 7 - ICJ Feb Openaccess 2026
P. 7
TECHNICAL PAPER
A superplasticizer equivalent to 1 % of the cement weight was
Start
utilised. As pumice absorbed water, the water content increased
↓
due to coarse aggregate replacement with pumice. The findings
Testing of Materials Used of the slump cone test revealed that the concrete of grade
In Experimental Study
M30 attained a slump of 120 mm, whereas grade M50 attained
↓
125 mm. Control concrete (CC) refers to the normal mixes for
Mix Design M30 and both M30 and M50 grades that do not contain any pumice
M50 Control Concrete
substitution. For the M30 and M50 concrete mixes, various
↓
replacement percentages of normal coarse aggregate (NCA) by
Casting of Samples Cubes for Control lightweight pumice coarse aggregate (PCA) were assessed at 20,
Concrete and Pumice Based Concrete
40, 60, 80, and 100 %.
↓
28 Days Curing 5.2 Compressive strength test
↓
Three cubes measuring 150 × 150 × 150 mm each were
Mechanical Tests produced for the M30 and M50 control concrete samples. In
1. Compressive Strength Test To Determine Optimal Dosage
of Pumice CA 1. addition, three 150 × 150 × 150 mm cube samples were cast
2. Tensile Strength Test for every percentage that the pumice coarse aggregate was
3. Modulus of Rupture Test
replaced with. Based on the results of the compressive strength
↓ test, the ideal dosage of lightweight pumice coarse aggregate
Acid resistance test for durability & (PCA) for the M30 and M50 classes of concrete was established.
Microstructural Analysis (Scanning Electron
Microscopy (SEM), X-Ray Diffraction (XRD), and Designations given to the different replacement mix proportions
Energy Dispersive Spectroscopy (EDS) is as shown in Table 4.
↓
It was found that the concrete’s compressive strength dropped
Results and Discussions as pumice substitution increased. The data is as shown in
↓ Figures 3(a) and 3(b).
Conclusions The M30 and M50 concrete mixes’ compressive strength at
Figure 2: Methodology flowchart 28 days with varying percentages of pumice coarse aggregate
substitution (20, 40, 60, 80, and 100 %). The compressive
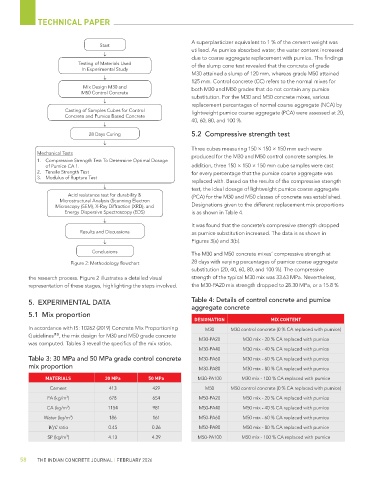
the research process. Figure 2 illustrates a detailed visual strength of the typical M30 mix was 33.63 MPa. Nevertheless,
representation of these stages, highlighting the steps involved. the M30-PA20 mix strength dropped to 28.30 MPa, or a 15.8 %
5. EXPERIMENTAL DATA Table 4: Details of control concrete and pumice
aggregate concrete
5.1 Mix proportion
DESIGNATION MIX CONTENT
In accordance with IS: 10262 (2019) Concrete Mix Proportioning M30 M30 control concrete (0 % CA replaced with pumice)
Guidelines [13] , the mix design for M30 and M50 grade concrete
was computed. Tables 3 reveal the specifics of the mix ratios. M30-PA20 M30 mix - 20 % CA replaced with pumice
M30-PA40 M30 mix - 40 % CA replaced with pumice
Table 3: 30 MPa and 50 MPa grade control concrete M30-PA60 M30 mix - 60 % CA replaced with pumice
mix proportion M30-PA80 M30 mix - 80 % CA replaced with pumice
MATERIALS 30 MPa 50 MPa M30-PA100 M30 mix - 100 % CA replaced with pumice
Cement 413 429 M50 M50 control concrete (0 % CA replaced with pumice)
3
FA (kg/m ) 678 654 M50-PA20 M50 mix - 20 % CA replaced with pumice
3
CA (kg/m ) 1154 981 M50-PA40 M50 mix - 40 % CA replaced with pumice
Water (kg/m ) 186 161 M50-PA60 M50 mix - 60 % CA replaced with pumice
3
W/C ratio 0.45 0.26 M50-PA80 M50 mix - 80 % CA replaced with pumice
3
SP (kg/m ) 4.13 4.29 M50-PA100 M50 mix - 100 % CA replaced with pumice
58 THE INDIAN CONCRETE JOURNAL | FEBRUARY 2026