
Page 63 - ICJ Jan 2023
P. 63
TECHNICAL PAPER COLLECTOR’S EDITION
was varied by mixing the soil and sand in various thoroughly mixed by hand. Any lumps formed while
proportions. This type of reconstitution was done mixing water are broken by hand so that the water
mainly to vary the sand and clay content of a soil. is uniformly distributed in soil-cement mixture.
The wetted soil-cement mixture is moulded into a
Soil-cement blocks used for masonry construction cube of size 76 mm, employing static compaction
are normally bigger in size compared to process using a metal mould and hydraulic jack.
conventional bricks. Since it is difficult to study
the effect of various parameters using bigger soil- The bulk density of the soil-cement cubes in all the
3
cement block specimens, the tests were carried out cases is kept constant at 20.2 kN/m , which can be
on smaller cubes of size 76mm. These cubes were easily controlled by taking a definite amount of soil-
produced using a static compaction process similar cement mixture. The moulding water content is
to the one employed in the soil block making also controlled within a narrow range such that the
machines. dry density of the soil-cement cubes is in the range
3
of about 18.05 kN/m with a variation of about 3
PREPARATION AND TESTING OF percent. The moulding water content cannot be
SPECIMENS based on Proctor OMC, because the Proctor OMC
varies with the soil composition leading to different
Dried and powdered soil sample is mixed with the dry densities. Also the energy supplied in a Proctor
required quantity of portland cement, manually. test is different compared to the energy supplied
In the case of sand addition, powdered soil is in static compaction process employed in cube
mixed with sand prior to cement mixing. Grain making.
size distribution of sand used in these studies is
shown in Fig 2. The soil-cement mixture is spread
into a thin layer and then water is sprinkled and
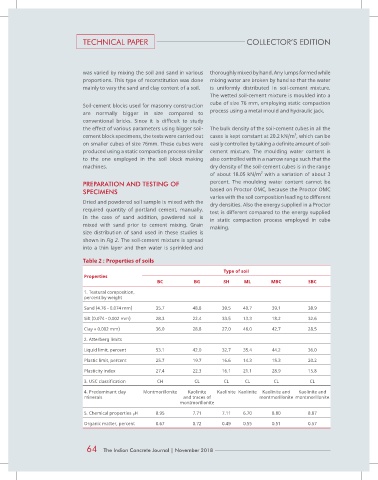
Table 2 : Properties of soils
Type of soil
Properties
BC BG SH ML MBC SBC
1. Textural composition,
percent by weight
Sand (4.76 - 0.074 mm) 35.7 48.8 39.5 40.7 39.1 38.9
Silt (0.074 - 0.002 mm) 28.3 22.4 33.5 13.3 18.2 32.6
Clay « 0.002 mm) 36.0 28.8 27.0 46.0 42.7 28.5
2. Atterberg limits
Liquid limit, percent 53.1 42.0 32.7 35.4 44.2 36.0
Plastic limit, percent 25.7 19.7 16.6 14.3 15.3 20.2
Plasticity index 27.4 22.3 16.1 21.1 28.9 15.8
3. USC classification CH CL CL CL CL CL
4. Predominant clay Montmorillonite Kaolinite Kaolinite Kaolinite Kaolinite and Kaolinite and
minerals and traces of montmorillonite montmorillonite
montmorillonite
5. Chemical properties H 8.95 7.71 7.11 6.70 8.80 8.87
P
Organic matter, percent 0.67 0.72 0.49 0.55 0.51 0.57
64 The Indian Concrete Journal | November 2018