
Page 2 - Open-Access-Nov-2020
P. 2
TECHNICAL PAPER
that reference (usually copper/copper sulphate or silver/silver • corrosion by chlorides assumes high degree of
chloride electrodes). saturation and then the values would be in the
cathodic range and in general more stable providing
The contact of the reference electrode and the concrete has to the structure is submerged or permanently wet.
be moist. Therefore, concrete of 1 to 2 mm should be saturated
well in order to minimize the surface resistance. The saturation Table 1 shows the values indicated in the Rilem
is also provided by using a wet sponge between the probe and Recommendation where some general comments are given for
the concrete surface. The procedure explained should be taken the possible (in some cases very wide) ranges. The difficulties
into account in all electrochemical measurements in concrete. in the interpretation of the E corr values is also recognized in
That is it also applies for the measurement of the electrical the ASTM 879-14 standard by not giving any table for that
resistance or of the corrosion rate. interpretation.
2.1.1 Interpretation In order to avoid the risk of misinterpretation of individual
measurements, Rilem Recommendation and ASTM C876
The corrosion potential indicates the “state” of corrosion of the standard recommend not taking individual values but to
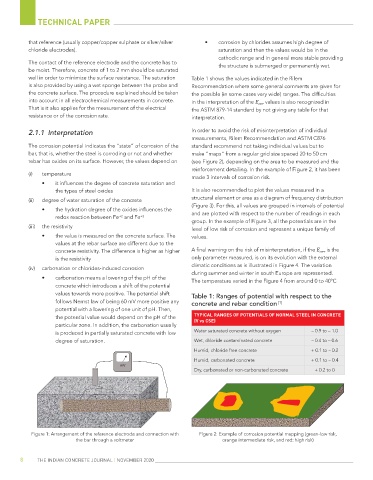
bar, that is, whether the steel is corroding or not and whether make “maps” from a regular grid size spaced 20 to 50 cm
rebar has oxides on its surface. However, the values depend on (see Figure 2), depending on the area to be measured and the
reinforcement detailing. In the example of Figure 2, it has been
(i) temperature
made 3 intervals of corrosion risk.
• it influences the degree of concrete saturation and
the types of steel oxides It is also recommended to plot the values measured in a
(ii) degree of water saturation of the concrete structural element or area as a diagram of frequency distribution
(Figure 3). For this, all values are grouped in intervals of potential
• the hydration degree of the oxides influences the
redox reaction between Fe and Fe +3 and are plotted with respect to the number of readings in each
+2
group. In the example of Figure 3, all the potentials are in the
(iii) the resistivity
level of low risk of corrosion and represent a unique family of
• the value is measured on the concrete surface. The values.
values at the rebar surface are different due to the
concrete resistivity. The difference is higher as higher A final warning on the risk of misinterpretation, if the E corr is the
is the resistivity only parameter measured, is on its evolution with the external
(iv) carbonation or chlorides-induced corrosion climatic conditions as is illustrated in Figure 4. The variation
during summer and winter in south Europe are represented.
• carbonation means a lowering of the pH of the The temperature varied in the Figure 4 from around 0 to 40ºC
concrete which introduces a shift of the potential
values towards more positive. The potential shift Table 1: Ranges of potential with respect to the
follows Nernst law of being 60 mV more positive any concrete and rebar condition [1]
potential with a lowering of one unit of pH. Then,
the potential value would depend on the pH of the TYPICAL RANGES OF POTENTIALS OF NORMAL STEEL IN CONCRETE
(V vs CSE)
particular zone. In addition, the carbonation usually
is produced in partially saturated concrete with low Water saturated concrete without oxygen – 0.9 to – 1.0
degree of saturation. Wet, chloride contaminated concrete – 0.4 to – 0.6
Humid, chloride free concrete + 0.1 to – 0.2
Humid, carbonated concrete + 0.1 to – 0.4
mV
Dry, carbonated or non-carbonated concrete + 0.2 to 0
Figure 1: Arrangement of the reference electrode and connection with Figure 2: Example of corrosion potential mapping (green-low risk,
the bar through a voltmeter orange intermediate risk, and red: high risk)
8 THE INDIAN CONCRETE JOURNAL | NOVEMBER 2020