
Page 3 - Open-Access-Nov-2020
P. 3
TECHNICAL PAPER
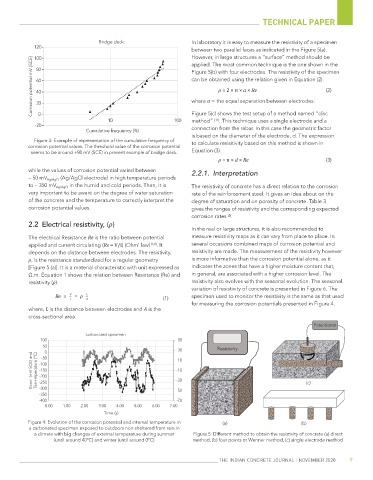
Bridge deck In laboratory it is easy to measure the resistivity of a specimen
120
between two parallel faces as indicated in the Figure 5(a).
However, in large structures a “surface” method should be
Corrosion potential mV (SCE) 80 Figure 5(b) with four electrodes. The resistivity of the specimen
100
applied. The most common technique is the one shown in the
can be obtained using the relation given in Equation (2).
60
ρ = 2 × π × a × Re
(2)
40
where a = the equal separation between electrodes:
20
0
method” . This technique uses a single electrode and a
[11]
10 100 Figure 5(c) shows the test setup of a method named “disc
-20 connection from the rebar. In this case the geometric factor
Cumulative frequency (%)
is based on the diameter of the electrode, d. The expression
Figure 3: Example of representation of the cumulative frequency of to calculate resisitivity based on this method is shown in
corrosion potential values. The threshold value of the corrosion potential
seems to be around +80 mV (SCE) in present example of bridge deck. Equation (3).
ρ = π × d × Re (3)
while the values of corrosion potential varied between 2.2.1. Interpretation
– 50 mV Ag/AgCl (Ag/AgCl electrode) in high temperature periods
to – 350 mV Ag/AgCl in the humid and cold periods. Then, it is The resistivity of concrete has a direct relation to the corrosion
very important to be aware on the degree of water saturation rate of the reinforcement steel. It gives an idea about on the
of the concrete and the temperature to correctly interpret the degree of saturation and on porosity of concrete. Table 3
corrosion potential values. gives the ranges of resistivity and the corresponding expected
corrosion rates .
[3]
2.2 Electrical resistivity, (ρ)
In the real or large structures, it is also recommended to
The electrical Resistance Re is the ratio between potential measure resistivity maps as it can vary from place to place. In
applied and current circulating (Re = V/I) (Ohm’ law) [3,8] . It several occasions combined maps of corrosion potential and
depends on the distance between electrodes. The resistivity, resistivity are made. The measurement of the resistivity however
ρ, is the resistance standardized for a regular geometry is more informative than the corrosion potential alone, as it
[Figure 5 (a)]. It is a material characteristic with unit expressed as indicates the zones that have a higher moisture content that,
Ω.m. Equation 1 shows the relation between Resistance (Re) and in general, are associated with a higher corrosion level. The
resistivity (ρ). resistivity also evolves with the seasonal evolution. The seasonal
variation of resistivity of concrete is presented in Figure 6. The
(1) specimen used to monitor the resistivity is the same as that used
for measuring the corrosion potentials presented in Figure 4.
where, L is the distance between electrodes and A is the
cross-sectional area.
Potentiostat
carbonated specimen
100 50
50
30 Resistivity
0 10
Ecorr (mV SCE) and Ten+mperature (ºC) -100 -10
-50
-150
-200
-30
-250
-300
-50 (c)
-350
-400 -70
0.00 1.00 2.00 3.00 4.00 5.00 6.00 7.00
Time (y)
Figure 4: Evolution of the corrosion potential and internal temperature in (a) (b)
a carbonated specimen exposed to outdoors non-sheltered from rain in
a climate with big changes of external temperature during summer Figure 5: Different method to obtain the resistivity of concrete (a) direct
(until around 40ºC) and winter (until around 0ºC) method, (b) four points or Wenner method, (c) single electrode method
THE INDIAN CONCRETE JOURNAL | NOVEMBER 2020 9