
Page 7 - ICJ Feb Openaccess 2026
P. 7
TECHNICAL PAPER
of cracks [20,30,31] . Adding steel fibres in beams can also alter of modified fibre factor, F’= α f V f , where V f is the volume fraction
the failure mode from shear failure to flexural mode, thereby of fibres, α f is the aspect ratio of fibre (= l f /d f );lf and df are
increasing the ductility of these members [19,25,28,32] . Previous length and diameter of fibre, respectively. There is scatter in
experimental studies showed that strength increase due to fibre the strength ratio, with a coefficient of variation of around 0.33,
content is also dependent on shear span to depth ratios. The due to the inherent variability of the strength of SFRC. Most of
load-carrying capacity is observed to increase from 1.62 to 1.89 the test specimens were small-sized with high percentages of
[33]
times for shear span to depth ratio of one . However, at higher main reinforcement, due to which crushing of the diagonal strut
values of shear span to depth ratios, the increase was not so governed the failure. Here, concrete strength becomes critical,
significant. resulting in the observed variability.
The mean strength ratios obtained are 1.42, 1.70, 1.64, 1.70,
127 SFRC deep beams with shear span-to-depth ratios less
than 2, collected from the literature (Appendix 1) were used 2.07, and 1.97 for F’=0, 0<F’≤0.25, 0.25 % <F’≤0.50, 0.5<F’≤
to study the influence of fibre content and type of fibre on 0.75, 0.75<F’≤1 and 1<F’≤1.25 respectively. An average increase
strength [6,18-20,23-28] . Control specimens with no fibre content were of strength of around 37 % for a fibre factor, F’ of 1, when
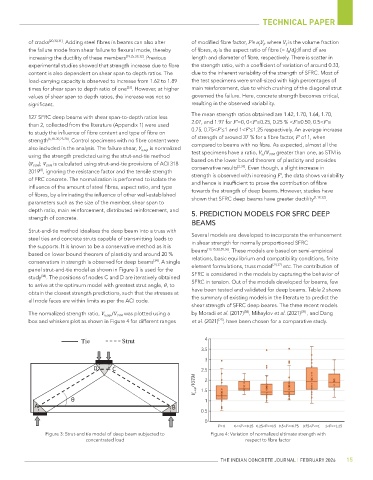
also included in the analysis. The failure shear, V u,exp is normalized compared to beams with no fibre. As expected, almost all the
using the strength predicted using the strut-and-tie method test specimens have a ratio, V u /V STM greater than one, as STM is
(V STM ); V STM is calculated using strut-and-tie provisions of ACI 318 based on the lower bound theorem of plasticity and provides
[2,34]
[8]
2019 , ignoring the resistance factor and the tensile strength conservative results . Even though, a slight increase in
strength is observed with increasing F’, the data shows variability
of FRC concrete. The normalization is performed to isolate the and hence is insufficient to prove the contribution of fibre
influence of the amount of steel fibres, aspect ratio, and type towards the strength of deep beams. However, studies have
of fibres, by eliminating the influence of other well-established [1,19,32]
parameters such as the size of the member, shear span to shown that SFRC deep beams have greater ductility .
depth ratio, main reinforcement, distributed reinforcement, and 5. PREDICTION MODELS FOR SFRC DEEP
strength of concrete.
BEAMS
Strut-and-tie method idealises the deep beam into a truss with
steel ties and concrete struts capable of transmitting loads to Several models are developed to incorporate the enhancement
the supports. It is known to be a conservative method as it is in shear strength for normally proportioned SFRC
[13,15,32,35,36]
based on lower bound theorem of plasticity and around 20 % beams . These models are based on semi-empirical
[34]
conservatism in strength is observed for deep beams . A single relations, basic equilibrium and compatibility conditions, finite
[24,37]
panel strut-and-tie model as shown in Figure 3 is used for the element formulations, truss model etc. The contribution of
study . The positions of nodes C and D are iteratively obtained SFRC is considered in the models by capturing the behavior of
[34]
to arrive at the optimum model with greatest strut angle, θ, to SFRC in tension. Out of the models developed for beams, few
obtain the closest strength predictions, such that the stresses at have been tested and validated for deep beams. Table 2 shows
all node faces are within limits as per the ACI code. the summary of existing models in the literature to predict the
shear strength of SFRC deep beams. The three recent models
[38]
The normalized strength ratio, V u,exp /V STM was plotted using a by Moradi et al. (2017) , Mihaylov et al. (2021) [39] , and Dang
box and whiskers plot as shown in Figure 4 for different ranges et al. (2021) , have been chosen for a comparative study.
[25]
Tie Strut 4
3.5
3
D C 2.5
/VSTM 2
V u, exp 1.5
1
A B
0.5
0
F’
F’= 0 0<=F’<=0.25 0.25< <=0.5 0.5<F’<=0.75 0.75<F’<=1 1< <=1.25
F’
Figure 3: Strut-and tie model of deep beam subjected to Figure 4: Variation of normalized ultimate strength with
concentrated load respect to fibre factor
THE INDIAN CONCRETE JOURNAL | FEBRUARY 2026 15