
Page 20 - Open-Access-Sep-2019
P. 20
TECHNICAL PAPER
to the higher density of the specimens in the conventional paste experienced the highest strength loss as the temperature
mix than the printed mix. The density of the printed object increased. The best result was at (70°C) [33] . The results of the
3
was approximately 0.0017 g/mm which was recorded for the Abdulkareem, Mustafa Al Bakri, Kamarudin, Khairul Nizar
highest saturation level, whereas the density of the conventional and Saif [33] are consistent with that of the presented study for
mix was approximately 0.0021 g/mm . According to Reis [31] , cement mortar-based 3DP objects, which were tested at various
3
the mechanical strength of the polymer mortar specimens was temperatures.
reduced by 50% when temperature increased to 80°C. In our
study, this was the case for conventional mortar specimens but
not for printed specimens. Reis [31] observed that strain had a
higher value at 80°C than for other curing temperatures, similar
to the experimental work conducted in this research.
The prism specimens were prepared and subjected to the three-
point bending test [32] . The size of the specimens was chosen
based on the conventional standard prism for mortar, namely,
160×40×40 mm.
As shown in Figure 9, the investigation of mechanical properties
using the three-point bending test found higher flexural
strengths at (80°C). Clearly, the 80°C curing temperature results
in better performance than other curing temperatures. It can be
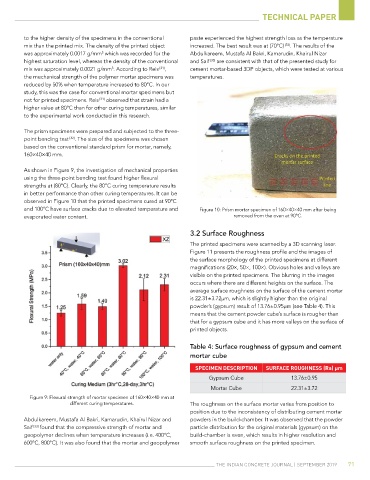
observed in Figure 10 that the printed specimens cured at 90°C
and 100°C have surface cracks due to elevated temperature and Figure 10: Prism mortar specimen of 160×40×40 mm after being
evaporated water content. removed from the oven at 90°C.
3.2 Surface roughness
The printed specimens were scanned by a 3D scanning laser.
Figure 11 presents the roughness profile and the images of
the surface morphology of the printed specimens at different
magnifications (20×, 50×, 100×). Obvious holes and valleys are
visible on the printed specimens. The blurring in the images
occurs where there are different heights on the surface. The
average surface roughness on the surface of the cement mortar
is 22.31±3.72µm, which is slightly higher than the original
powder’s (gypsum) result of 13.76±0.95µm (see Table 4). This
means that the cement powder cube’s surface is rougher than
that for a gypsum cube and it has more valleys on the surface of
printed objects.
table 4: surface roughness of gypsum and cement
mortar cube
sPEcIMEn DEscrIPtIon sUrfAcE roUghnEss (ra) µm
Gypsum Cube 13.76±0.95
Mortar Cube 22.31±3.72
Figure 9: Flexural strength of mortar specimen of 160×40×40 mm at
different curing temperatures. The roughness on the surface mortar varies from position to
position due to the inconsistency of distributing cement mortar
Abdulkareem, Mustafa Al Bakri, Kamarudin, Khairul Nizar and powders in the build-chamber. It was observed that the powder
Saif [33] found that the compressive strength of mortar and particle distribution for the original materials (gypsum) on the
geopolymer declines when temperature increases (i.e. 400°C, build-chamber is even, which results in higher resolution and
600°C, 800°C). It was also found that the mortar and geopolymer smooth surface roughness on the printed specimen.
The IndIan ConCreTe Journal | SepTember 2019 71