
Page 6 - Open-Access-Oct-2020
P. 6
TECHNICAL PAPER
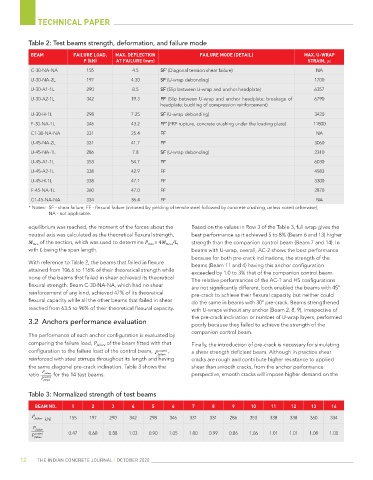
Table 2: Test beams strength, deformation, and failure mode
BEAM FAILURE LOAD, MAX. DEFLECTION FAILURE MODE (DETAIL) MAX. U-WRAP
P (kN) AT FAILURE (mm) STRAIN, με
C-30-NA-NA 155 4.5 SF (Diagonal tension shear failure) NA
*
U-30-NA-2L 197 4.30 SF (U-wrap debonding) 1700
U-30-A1-1L 290 8.5 SF (Slip between U-wrap and anchor headplate) 6357
U-30-A2-1L 342 19.3 FF (Slip between U-wrap and anchor headplate; breakage of 6790
headplate; buckling of compression reinforcement)
U-30-H-1L 298 7.25 SF (U-wrap debonding) 3420
F-30-NA-1L 346 43.2 FF (FRP rupture, concrete crushing under the loading plate) 11800
*
C1-30-NA-NA 331 25.4 FF NA
U-45-NA-2L 331 41.7 FF 3060
U-45-NA-1L 286 7.8 SF (U-wrap debonding) 2310
U-45-A1-1L 353 54.7 FF 6030
U-45-A2-1L 338 42.9 FF 4583
U-45-H-1L 338 47.1 FF 3300
F-45-NA-1L 360 47.0 FF 2870
C1-45-NA-NA 334 36.4 FF NA
* Notes: SF - shear failure, FF - flexural failure (initiated by yielding of tensile steel followed by concrete crushing, unless noted otherwise),
NA - not applicable.
equilibrium was reached, the moment of the forces about the Based on the values in Row 3 of the Table 3, full wrap gives the
neutral axis was calculated as the theoretical flexural strength, best performance as it achieved 5 to 8% (Beam 6 and 13) higher
M theo of the section, which was used to determine P theo = 4M theo /L, strength than the companion control beam (Beam 7 and 14). In
with L being the span length. beams with U-wrap, overall, AC-2 shows the best performance
because for both pre-crack inclinations, the strength of the
With reference to Table 2, the beams that failed in flexure beams (Beam 11 and 4) having this anchor configuration
attained from 106.6 to 116% of their theoretical strength while exceeded by 1.0 to 3% that of the companion control beam.
none of the beams that failed in shear achieved its theoretical The relative performances of the AC-1 and HS configurations
flexural strength. Beam C-30-NA-NA, which had no shear are not significantly different, both enabled the beams with 45°
reinforcement of any kind, achieved 47% of its theoretical pre-crack to achieve their flexural capacity, but neither could
flexural capacity while all the other beams that failed in shear do the same in beams with 30° pre-crack. Beams strengthened
reached from 63.5 to 96% of their theoretical flexural capacity. with U-wraps without any anchor (Beam 2, 8, 9), irrespective of
the pre-crack inclination or number of U-wrap layers, performed
3.2 Anchors performance evaluation poorly because they failed to achieve the strength of the
companion control beam.
The performance of each anchor configuration is evaluated by
comparing the failure load, P failure of the beam fitted with that Finally, the introduction of pre-crack is necessary for simulating
control ,
configuration to the failure load of the control beam, P failure a shear strength deficient beam. Although in practice shear
reinforced with steel stirrups throughout its length and having cracks are rough and contribute higher resistance to applied
the same diagonal pre-crack inclination. Table 3 shows the shear than smooth cracks, from the anchor performance
ratio for the 14 test beams. perspective, smooth cracks will impose higher demand on the
Table 3: Normalized strength of test beams
BEAM NO. 1 2 3 4 5 6 7 8 9 10 11 12 13 14
P failure kN 155 197 290 342 298 346 331 331 286 353 338 338 360 334
0.47 0.60 0.88 1.03 0.90 1.05 1.00 0.99 0.86 1.06 1.01 1.01 1.08 1.00
12 THE INDIAN CONCRETE JOURNAL | OCTOBER 2020