
Page 4 - Open-Access-September-2020
P. 4
TECHNICAL PAPER
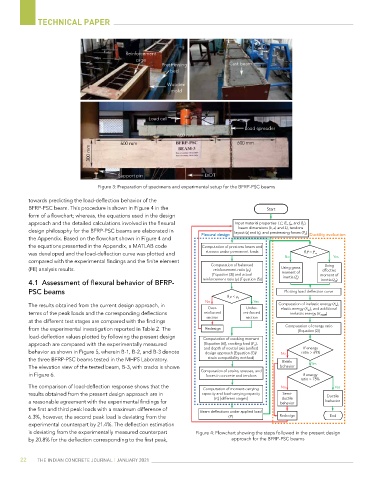
Reinforcement
cage
Prestressing Cast beam
bed
Wooden
mold
Load cell
Load spreader
600 mm
600 mm 600 mm
300 mm
Support pin LVDT
Figure 3: Preparation of specimens and experimental setup for the BFRP-PSC beams
towards predicting the load-deflection behavior of the
BFRP-PSC beam. This procedure is shown in Figure 4 in the Start
form of a flowchart; whereas, the equations used in the design
approach and the detailed calculations involved in the flexural Input material properties ( f c Ef and f E ),
,,
',
c
fu
L
bd
beam dimensions (, , and ), tendons
design philosophy for the BFRP-PSC beams are elaborated in layout ( and ), and prestressing forces (F pi )
d j
h j
the Appendix. Based on the flowchart shown in Figure 4 and Flexural desig n Ductility e valuation
the equations presented in the Appendix, a MATLAB code Computation of prestress losses and
was developed and the load-deflection curve was plotted and stresses under permanent loads If P > P cr
No Yes
compared with the experimental findings and the finite element
Computation of balanced Using
(FE) analysis results. reinforcement ratio () Using gross effective
ρ b
[Equation (3)] and actual moment of moment of
inertia ()
ρ
reinforcement ratio () [Equation (5)] I g inertia ()
4.1 Assessment of flexural behavior of BFRP-
I eff
PSC beams Plotting load-deflection curve
If ρ < ρ b
No Yes
The results obtained from the current design approach, in Computation of inelastic energy (),
E in
Over- Under- elastic energy (E esc ), and additional
terms of the peak loads and the corresponding deflections reinforced reinforced inelastic energy (E in addl( ) )
section section
at the different test stages are compared with the findings
Computation of energy ratio
from the experimental investigation reported in Table 2. The Redesign [Equation (2)]
load-deflection values plotted by following the present design
Computation of cracking moment
approach are compared with the experimentally measured [Equation (6)], cracking load (P cr ),
and depth of neutral axis (unified If energy
behavior as shown in Figure 5, wherein B-1, B-2, and B-3 denote design approach [Equation (7)]/ No ratio > 69%
the three BFRP-PSC beams tested in the MHPS Laboratory. strain compatibility method) Brittle
The elevation view of the tested beam, B-3, with cracks is shown behavior Yes
Computation of strains, stresses, and
in Figure 6. forces in concrete and tendons If energy
ratio > 75%
The comparison of load-deflection response shows that the No Yes
Computation of moment-carrying
results obtained from the present design approach are in capacity and load-carrying capacity Semi- Ductile
ductile
a reasonable agreement with the experimental findings for () [different stages] behavior behavior
P n
the first and third peak loads with a maximum difference of Beam deflections under applied load
6.3%, however, the second peak load is deviating from the () Redesign End
P
experimental counterpart by 21.4%. The deflection estimation
is deviating from the experimentally measured counterpart Figure 4: Flowchart showing the steps followed in the present design
by 20.8% for the deflection corresponding to the first peak, approach for the BFRP-PSC beams
22 THE INDIAN CONCRETE JOURNAL | JANUARY 2021