
Page 5 - Open-Access-September-2020
P. 5
TECHNICAL PAPER
Table 2: Flexural analysis results of the BFRP-PSC
beam compared to the experimental findings
STAGE PRE- POST- POST-
FAILURE FIRST SECOND
RUPTURE RUPTURE
Balanced ratio, 'ρ b ' 0.0053 0.0053 0.0027
Reinforcement ratio, 'ρ' 0.0026 0.0024 0.002
Depth of neutral axis (mm) 30.5 26.0 21.7
Load-carrying Present 114.1 94.6 92.3
capacity (kN) approach
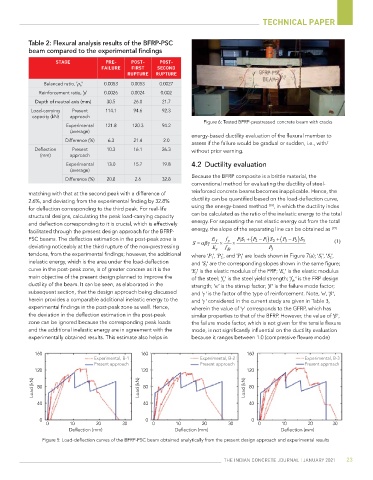
Figure 6: Tested BFRP-prestressed concrete beam with cracks
Experimental 121.8 120.3 94.2
(average)
energy-based ductility evaluation of the flexural member to
Difference (%) 6.3 21.4 2.0
assess if the failure would be gradual or sudden, i.e., with/
Deflection Present 10.3 16.1 26.3 without prior warning.
(mm) approach
Experimental 13.0 15.7 19.8 4.2 Ductility evaluation
(average)
Because the BFRP composite is a brittle material, the
Difference (%) 20.8 2.6 32.8
conventional method for evaluating the ductility of steel-
matching with that at the second peak with a difference of reinforced concrete beams becomes inapplicable. Hence, the
2.6%, and deviating from the experimental finding by 32.8% ductility can be quantified based on the load-deflection curve,
[19]
for deflection corresponding to the third peak. For real-life using the energy-based method , in which the ductility index
structural designs, calculating the peak load-carrying capacity can be calculated as the ratio of the inelastic energy to the total
and deflection corresponding to it is crucial, which is effectively energy. For separating the net elastic energy out from the total
facilitated through the present design approach for the BFRP- energy, the slope of the separating line can be obtained as [19]
PSC beams. The deflection estimation in the post-peak zone is S E f f y PS P 22 P S 3 PS (1)
P 3
2
11
1
deviating noticeably at the third rupture of the non-prestressing E s f ds P 3
tendons, from the experimental findings; however, the additional where 'P 1 ', 'P 2 ', and 'P 3 ' are loads shown in Figure 7(a); 'S 1 ', 'S 2 ',
inelastic energy, which is the area under the load-deflection and 'S 3 ' are the corresponding slopes shown in the same figure;
curve in the post-peak zone, is of greater concern as it is the 'E f ' is the elastic modulus of the FRP; 'E s ' is the elastic modulus
main objective of the present design planned to improve the of the steel; 'f y ' is the steel yield strength; 'f ds ' is the FRP design
ductility of the beam. It can be seen, as elaborated in the strength; 'α ' is the stirrup factor; 'β' is the failure mode factor;
subsequent section, that the design approach being discussed and 'γ ' is the factor of the type of reinforcement. Note, 'α', 'β',
herein provides a comparable additional inelastic energy to the and 'γ ' considered in the current study are given in Table 3,
experimental findings in the post-peak zone as well. Hence, wherein the value of 'γ ' corresponds to the GFRP, which has
the deviation in the deflection estimation in the post-peak similar properties to that of the BFRP. However, the value of 'β',
zone can be ignored because the corresponding peak loads the failure mode factor, which is not given for the tensile flexure
and the additional inelastic energy are in agreement with the mode, is not significantly influential on the ductility evaluation
experimentally obtained results. This estimate also helps in because it ranges between 1.0 (compressive flexure mode)
160 160 160
Experimental, B-1 Experimental, B-2 Experimental, B-3
Present approach Present approach Present approach
120 120 120
Load (kN) 80 Load (kN) 80 Load (kN) 80
40 40 40
0 0 0
0 10 20 30 0 10 20 30 0 10 20 30
Deflection (mm) Deflection (mm) Deflection (mm)
Figure 5: Load-deflection curves of the BFRP-PSC beam obtained analytically from the present design approach and experimental results
THE INDIAN CONCRETE JOURNAL | JANUARY 2021 23