
Page 6 - Open-Access-September-2020
P. 6
TECHNICAL PAPER
Grace et al. (1998) [19]
Present approach
120 P 2
P 3
P 2
S 3
S 1
S 2
S 2 80
Load Load (kN) P 1
Inelastic S
P 1 energy E in S
()
E in
40 Additional inelastic
Elastic energy
) S 1 energy
(E esc
E esc [E in addl( ] )
0
0 10 20 30
Deflection Deflection (mm)
(a) (b)
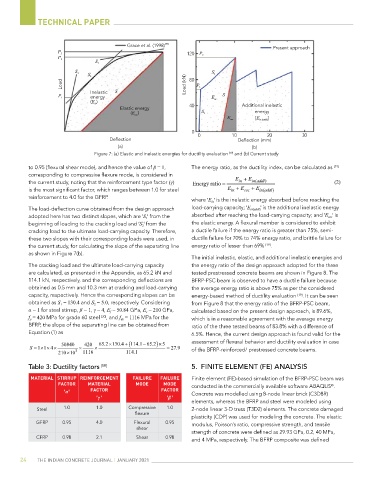
Figure 7: (a) Elastic and inelastic energies for ductility evaluation [19] and (b) Current study
to 0.95 (flexural shear mode), and hence the value of β = 1, The energy ratio, as the ductility index, can be calculated as [19]
corresponding to compressive flexure mode, is considered in
the current study, noting that the reinforcement type factor (γ) Energy ratio E in E in (addl ) (2)
is the most significant factor, which ranges between 1.0 for steel E in E esc E in (addl )
reinforcement to 4.0 for the GFRP.
where 'E in ' is the inelastic energy absorbed before reaching the
The load-deflection curve obtained from the design approach load-carrying capacity; 'E in(addl) ' is the additional inelastic energy
adopted here has two distinct slopes, which are 'S 1 ' from the absorbed after reaching the load-carrying capacity; and 'E esc ' is
beginning of loading to the cracking load and 'S 2 ' from the the elastic energy. A flexural member is considered to exhibit
cracking load to the ultimate load-carrying capacity. Therefore, a ductile failure if the energy ratio is greater than 75%, semi-
these two slopes with their corresponding loads were used, in ductile failure for 70% to 74% energy ratio, and brittle failure for
the current study, for calculating the slope of the separating line energy ratio of lesser than 69% .
[19]
as shown in Figure 7(b).
The initial inelastic, elastic, and additional inelastic energies and
The cracking load and the ultimate load-carrying capacity the energy ratio of the design approach adopted for the three
are calculated, as presented in the Appendix, as 65.2 kN and tested prestressed concrete beams are shown in Figure 8. The
114.1 kN, respectively, and the corresponding deflections are BFRP-PSC beam is observed to have a ductile failure because
obtained as 0.5 mm and 10.3 mm at cracking and load-carrying the average energy ratio is above 75% as per the considered
capacity, respectively. Hence the corresponding slopes can be energy-based method of ductility evaluation . It can be seen
[19]
obtained as S 1 = 130.4 and S 2 = 5.0, respectively. Considering from Figure 8 that the energy ratio of the BFRP-PSC beam,
α = 1 for steel stirrup, β = 1, γ = 4, E f = 50.84 GPa, E s = 210 GPa, calculated based on the present design approach, is 89.6%,
f y = 420 MPa for grade 60 steel , and f ds = 1116 MPa for the which is in a reasonable agreement with the average energy
[20]
BFRP, the slope of the separating line can be obtained from ratio of the three tested beams of 83.8% with a difference of
Equation (1) as 6.5%. Hence, the current design approach is found valid for the
.
S 50840 420 65 2 130 4. 114 1652. . 5 27 9 assessment of flexural behavior and ductility evaluation in case
.
11 4
of the BFRP-reinforced/ prestressed concrete beams.
210 10 3 1116 114.1 1
Table 3: Ductility factors [19] 5. FINITE ELEMENT (FE) ANALYSIS
MATERIAL STIRRUP REINFORCEMENT FAILURE FAILURE Finite element (FE)-based simulation of the BFRP-PSC beam was
FACTOR MATERIAL MODE MODE conducted in the commercially available software ABAQUS .
®
'α' FACTOR FACTOR Concrete was modelled using 8-node linear brick (C3D8R)
'γ ' 'β'
elements, whereas the BFRP and steel were modeled using
Steel 1.0 1.0 Compressive 1.0 2-node linear 3-D truss (T3D2) elements. The concrete damaged
flexure
plasticity (CDP) was used for modeling the concrete. The elastic
GFRP 0.95 4.0 Flexural 0.95 modulus, Poisson’s ratio, compressive strength, and tensile
shear
strength of concrete were defined as 29.93 GPa, 0.2, 40 MPa,
CFRP 0.98 2.1 Shear 0.98
and 4 MPa, respectively. The BFRP composite was defined
24 THE INDIAN CONCRETE JOURNAL | JANUARY 2021