
Page 26 - ICJ Jan 2026
P. 26
TECHNICAL PAPER
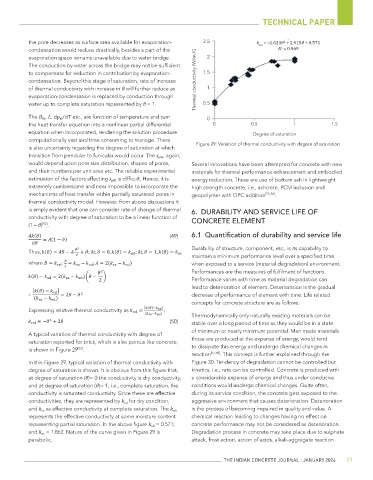
the pore decreases as surface area available for evaporation- 2.5 k = –1.623θ + 2.915θ + 0.571
2
em
2
condensation would reduce drastically, besides a part of the R = 0.969
evaporation space remains unavailable due to water bridge. 2
The conduction by water across the bridge may not be sufficient
to compensate for reduction in contribution by evaporation- 1.5
condensation. Beyond this stage of saturation, rate of increase Thermal conductivity (W/m.K)
of thermal conductivity with increase in θ will further reduce as 1
evaporation-condensation is replaced by conduction through
water up to complete saturation represented by θ = 1. 0.5
The D W , L, dp W /dT etc., are function of temperature and turn 0
the heat transfer equation into a nonlinear partial differential 0 0.5 1 1.5
equation when incorporated, rendering the solution procedure Degree of saturation
computationally vast and time consuming to manage. There
is also uncertainty regarding the degree of saturation at which Figure 29: Variation of thermal conductivity with degree of saturation
transition from pendular to funicular would occur. The s pW , again,
would depend upon pore size distribution, shapes of pores, Several innovations have been attempted for concrete with new
and their numbers per unit area etc. The reliable experimental materials for thermal performance enhancement and embodied
estimation of the factors affecting s pW is difficult. Hence, it is energy reduction. These are use of bottom ash in lightweight
extremely cumbersome and near impossible to incorporate the high strength concrete, i.e., ashcrete, PCM inclusion and
mechanisms of heat transfer within partially saturated pores in geopolymer with OPC addition [53-56] .
thermal conductivity model. However, from above discussions it
is amply evident that one can consider rate of change of thermal 6. DURABILITY AND SERVICE LIFE OF
conductivity with degree of saturation to be a linear function of CONCRETE ELEMENT
[52]
(1 – θ) ,
(49) 6.1 Quantification of durability and service life
Durability of structure, component, etc., is its capability to
Thus,
maintain a minimum performance level over a specified time
where when exposed to a service (material degradation) environment.
Performances are the measures of fulfilment of functions.
Performance varies with time as material degradation can
lead to deterioration of element. Deterioration is the gradual
decrease of performance of element with time. Life related
concepts for concrete structure are as follows.
Expressing relative thermal conductivity as
Thermodynamically only naturally existing materials can be
(50) stable over a long period of time as they would be in a state
of minimum or nearly minimum potential. Man made materials
A typical variation of thermal conductivity with degree of
saturation reported for brick, which is also porous like concrete, those are produced at the expense of energy, would tend
[52]
is shown in Figure 29 . to dissipate this energy and undergo chemical changes in
reaction [57,58] . This concept is further explained through the
In this Figure 29, typical variation of thermal conductivity with Figure 30. Tendency of degradation cannot be controlled but
degree of saturation is shown. It is obvious from this figure that, kinetics, i.e., rate can be controlled. Concrete is produced with
at degree of saturation (θ)= 0 the conductivity is dry conductivity, a considerable expense of energy and thus under conducive
and at degree of saturation (θ)= 1, i.e., complete saturation, the conditions would undergo chemical changes. Quite often,
conductivity is saturated conductivity. Since these are effective during its service condition, the concrete gets exposed to the
conductivities, they are represented by k ed for dry condition, aggressive environment that causes deterioration. Deterioration
and k es as effective conductivity at complete saturation. The k em is the process of becoming impaired in quality and value. A
represents the effective conductivity at some moisture content chemical reaction leading to changes having no effect on
representing partial saturation. In the above figure k ed = 0.571; concrete performance may not be considered as deterioration.
and k es = 1.863. Nature of the curve given in Figure 29 is Degradation process in concrete may take place due to sulphate
parabolic. attack, frost action, action of acids, alkali-aggregate reaction
THE INDIAN CONCRETE JOURNAL | JANUARY 2026 31