
Page 22 - ICJ Jan 2026
P. 22
TECHNICAL PAPER
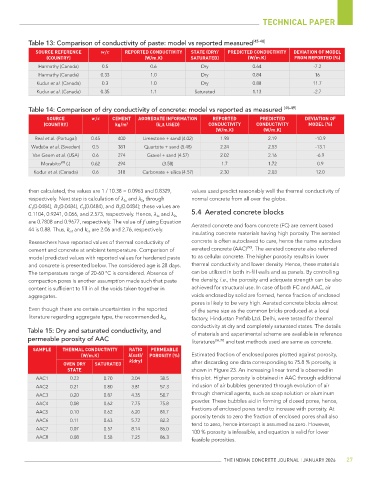
Table 13: Comparison of conductivity of paste: model vs reported measured [45-48]
SOURCE REFERENCE w/c REPORTED CONDUCTIVITY STATE (DRY/ PREDICTED CONDUCTIVITY DEVIATION OF MODEL
(COUNTRY) (W/m.K) SATURATED) (W/m.K) FROM REPORTED (%)
Harmathy (Canada) 0.5 0.6 Dry 0.64 -7.2
Harmathy (Canada) 0.33 1.0 Dry 0.84 16
Kudur et al. (Canada) 0.3 1.0 Dry 0.88 11.7
Kudur et al. (Canada) 0.35 1.1 Saturated 1.13 -2.7
Table 14: Comparison of dry conductivity of concrete: model vs reported as measured [45-49]
SOURCE w/c CEMENT AGGREGATE INFORMATION REPORTED PREDICTED DEVIATION OF
(COUNTRY) kg/m 3 (k s A USED) CONDUCTIVITY CONDUCTIVITY MODEL (%)
(W/m.K) (W/m.K)
Real et al. (Portugal) 0.45 400 Limestone + sand (4.02) 1.98 2.19 -10.9
Wadsöa et al. (Sweden) 0.5 381 Quartzite + sand (5.48) 2.24 2.53 -13.1
Van Geem et al. (USA) 0.6 274 Gravel + sand (4.57) 2.02 2.16 -6.9
[49]
Morabito (-) 0.62 294 (3.58) 1.7 1.72 0.9
Kodur et al. (Canada) 0.6 318 Carbonate + silica (4.57) 2.30 2.03 12.0
then calculated, the values are 1 / 10.38 = 0.0963 and 0.8329, values used predict reasonably well the thermal conductivity of
respectively. Next step is calculation of λ 1s and λ 2s through normal concrete from all over the globe.
C 1 (0.0484), D 1 (0.0484), C 2 (0.0484), and D 2 (0.0484); these values are
0.1104, 0.9241, 0.066, and 2.573, respectively. Hence, λ 1s and λ 2s 5.4 Aerated concrete blocks
are 0.7808 and 0.9677, respectively. The value of f using Equation Aerated concrete and foam concrete (FC) are cement based
44 is 0.88. Thus, k ed and k es are 2.06 and 2.76, respectively.
insulating concrete materials having high porosity. The aerated
Researchers have reported values of thermal conductivity of concrete is often autoclaved to cure, hence the name autoclave
[50]
cement and concrete at ambient temperature. Comparison of aerated concrete (AAC) . The aerated concrete also referred
model predicted values with reported values for hardened paste to as cellular concrete. The higher porosity results in lower
and concrete is presented below. The considered age is 28 days. thermal conductivity and lower density. Hence, these materials
The temperature range of 20-60 °C is considered. Absence of can be utilized in both in-fill walls and as panels. By controlling
compaction pores is another assumption made such that paste the density, i.e., the porosity and adequate strength can be also
content is sufficient to fill in all the voids taken together in achieved for structural use. In case of both FC and AAC, air
aggregates. voids enclosed by solid are formed, hence fraction of enclosed
pores is likely to be very high. Aerated concrete blocks almost
Even though there are certain uncertainties in the reported of the same size as the common bricks produced at a local
literature regarding aggregate type, the recommended k sA factory, Hindustan Prefab Ltd. Delhi, were tested for thermal
conductivity at dry and completely saturated states. The details
Table 15: Dry and saturated conductivity, and
of materials and experimental scheme are available in reference
permeable porosity of AAC literatures [36,39] and test methods used are same as concrete.
SAMPLE THERMAL CONDUCTIVITY RATIO PERMEABLE
(W/m.K) k(sat)/ POROSITY (%) Estimated fraction of enclosed pores plotted against porosity,
k(dry) after discarding one data corresponding to 75.8 % porosity, is
OVEN DRY SATURATED
STATE shown in Figure 23. An increasing linear trend is observed in
AAC1 0.23 0.70 3.04 38.5 this plot. Higher porosity is obtained in AAC through additional
AAC2 0.21 0.80 3.81 57.3 inclusion of air bubbles generated through evolution of air
AAC3 0.20 0.87 4.35 58.7 through chemical agents, such as soap solution or aluminum
powder. These bubbles aid in forming of closed pores, hence,
AAC4 0.08 0.62 7.75 75.8
fractions of enclosed pores tend to increase with porosity. At
AAC5 0.10 0.62 6.20 81.7
porosity tends to zero the fraction of enclosed pores shall also
AAC6 0.11 0.63 5.72 82.3
tend to zero, hence intercept is assumed as zero. However,
AAC7 0.07 0.57 8.14 86.0
100 % porosity is infeasible, and equation is valid for lower
AAC8 0.08 0.58 7.25 86.3
feasible porosities.
THE INDIAN CONCRETE JOURNAL | JANUARY 2026 27