
Page 17 - ICJ Jan 2026
P. 17
TECHNICAL PAPER
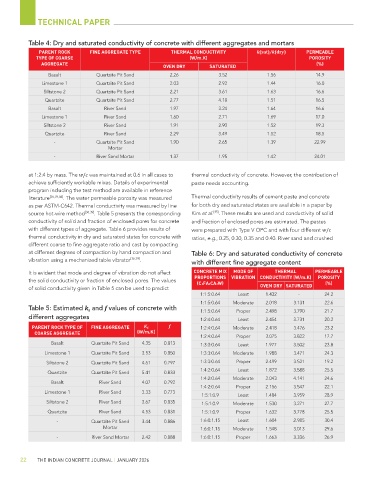
Table 4: Dry and saturated conductivity of concrete with different aggregates and mortars
PARENT ROCK FINE AGGREGATE TYPE THERMAL CONDUCTIVITY k(sat)/k(dry) PERMEABLE
TYPE OF COARSE (W/m.K) POROSITY
AGGREGATE (%)
OVEN DRY SATURATED
Basalt Quartzite Pit Sand 2.26 3.52 1.56 14.9
Limestone 1 Quartzite Pit Sand 2.03 2.92 1.44 16.0
Siltstone 2 Quartzite Pit Sand 2.21 3.61 1.63 16.6
Quartzite Quartzite Pit Sand 2.77 4.18 1.51 16.5
Basalt River Sand 1.97 3.24 1.64 16.6
Limestone 1 River Sand 1.60 2.71 1.69 17.0
Siltstone 2 River Sand 1.91 2.90 1.52 19.3
Quartzite River Sand 2.29 3.49 1.52 18.5
- Quartzite Pit Sand 1.90 2.65 1.39 22.99
Mortar
- River Sand Mortar 1.37 1.95 1.42 24.01
at 1:2:4 by mass. The w/c was maintained at 0.6 in all cases to thermal conductivity of concrete. However, the contribution of
achieve sufficiently workable mixes. Details of experimental paste needs accounting.
program including the test method are available in reference
literature [36,39,44] . The water permeable porosity was measured Thermal conductivity results of cement paste and concrete
as per ASTM-C642. Thermal conductivity was measured by line for both dry and saturated states are available in a paper by
source hot-wire method [36,39] . Table 5 presents the corresponding Kim et al. . These results are used and conductivity of solid
[45]
conductivity of solid and fraction of enclosed pores for concrete and fraction of enclosed pores are estimated. The pastes
with different types of aggregate. Table 6 provides results of were prepared with Type V OPC and with four different w/c
thermal conductivity in dry and saturated states for concrete with ratios, e.g., 0.25, 0.30, 0.35 and 0.40. River sand and crushed
different coarse to fine aggregate ratio and cast by compacting
at different degrees of compaction by hand compaction and Table 6: Dry and saturated conductivity of concrete
vibration using a mechanized table vibrator [36,39] .
with different fine aggregate content
It is evident that mode and degree of vibration do not affect CONCRETE MIX MODE OF THERMAL PERMEABLE
the solid conductivity or fraction of enclosed pores. The values PROPORTIONS VIBRATION CONDUCTIVITY (W/m.K) POROSITY
(C:FA:CA:W)
(%)
of solid conductivity given in Table 5 can be used to predict OVEN DRY SATURATED
1:1:5:0.64 Least 1.432 - 24.2
1:1:5:0.64 Moderate 2.018 3.131 22.6
Table 5: Estimated k and f values of concrete with 1:1:5:0.64 Proper 2.498 3.790 21.7
s
different aggregates 1:2:4:0.64 Least 2.454 3.731 20.2
PARENT ROCK TYPE OF FINE AGGREGATE K S f 1:2:4:0.64 Moderate 2.418 3.476 23.2
COARSE AGGREGATE (W/m.K)
1:2:4:0.64 Proper 3.075 3.822 17.7
Basalt Quartzite Pit Sand 4.35 0.813 1:3:3:0.64 Least 1.977 3.502 23.8
Limestone 1 Quartzite Pit Sand 3.53 0.850 1:3:3:0.64 Moderate 1.988 3.471 24.3
Siltstone 2 Quartzite Pit Sand 4.61 0.797 1:3:3:0.64 Proper 2.499 3.521 19.2
1:4:2:0.64 Least 1.872 3.588 25.5
Quartzite Quartzite Pit Sand 5.41 0.833
1:4:2:0.64 Moderate 2.043 4.141 24.6
Basalt River Sand 4.07 0.792
1:4:2:0.64 Proper 2.156 3.547 22.1
Limestone 1 River Sand 3.33 0.773
1:5:1:0.9 Least 1.484 3.959 28.9
Siltstone 2 River Sand 3.67 0.835 1:5:1:0.9 Moderate 1.530 3.271 27.7
Quartzite River Sand 4.53 0.831 1:5:1:0.9 Proper 1.632 3.778 25.5
- Quartzite Pit Sand 3.44 0.886 1:6:0:1.15 Least 1.604 2.985 30.4
Mortar 1:6:0:1.15 Moderate 1.548 3.013 29.6
- River Sand Mortar 2.42 0.888 1:6:0:1.15 Proper 1.663 3.336 26.9
22 THE INDIAN CONCRETE JOURNAL | JANUARY 2026