
Page 20 - ICJ Jan 2026
P. 20
TECHNICAL PAPER
7 6 2.5 3
Conductivity of solid W/m.K 5 4 3 2 k = 0.883V sand + 4.6859 Conductivity of solid W/m.K 1.5 2 1 k = 0.6026 V − 2.6392 V + 3.4331 k = − 1.8603 V + 3.2161
s
R² = 0.2239
2
p
s
R² = 0.9893
p
0 1 0.5 0 s R² = 0.9851
0 0.2 0.4 0.6 0.8 1 1.2 0 0.2 0.4 0.6 0.8 1 1.2
Volumetric sand content in aggregate (fraction) Volumetric paste content fraction
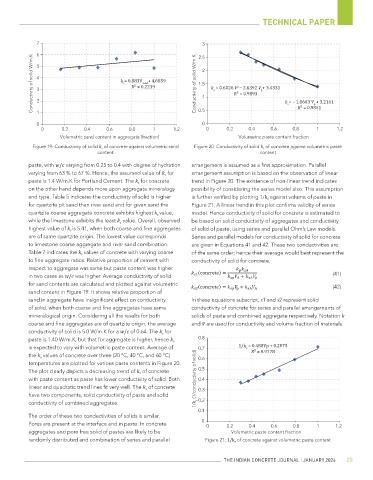
Figure 19: Conductivity of solid k s of concrete against volumetric sand Figure 20: Conductivity of solid k s of concrete against volumetric paste
content content
paste, with w/c varying from 0.25 to 0.4 with degree of hydration arrangement is assumed as a first approximation. Parallel
varying from 63 % to 67 %. Hence, the assumed value of k s for arrangement assumption is based on the observation of linear
paste is 1.4 W/m.K for Portland Cement. The k s for concrete trend in Figure 20. The existence of non-linear trend indicates
on the other hand depends more upon aggregate mineralogy possibility of considering the series model also. This assumption
and type. Table 5 indicates the conductivity of solid is higher is further verified by plotting 1/k s against volume of paste in
for quartzite pit sand than river sand and for given sand the Figure 21. A linear trend in this plot confirms validity of series
quartzite coarse aggregate concrete exhibits highest k s value, model. Hence conductivity of solid for concrete is estimated to
while the limestone exhibits the least k s value. Overall, observed be based on solid conductivity of aggregates and conductivity
highest value of k s is 5.41, when both coarse and fine aggregates of solid of paste, using series and parallel Ohm’s Law models.
are of same quartzite origin. The lowest value corresponds Series and parallel models for conductivity of solid for concrete
to limestone coarse aggregate and river sand combination. are given in Equations 41 and 42. These two conductivities are
Table 7 indicates the k s values of concrete with varying coarse of the same order; hence their average would best represent the
to fine aggregate ratios. Relative proportion of cement with conductivity of solid for concrete.
respect to aggregate was same but paste content was higher
in two cases as w/c was higher. Average conductivity of solid (41)
for sand contents are calculated and plotted against volumetric (42)
sand content in Figure 19. It shows relative proportion of
sand in aggregate have insignificant effect on conductivity In these equations subscript, s1 and s2 represent solid
of solid, when both coarse and fine aggregates have same conductivity of concrete for series and parallel arrangements of
mineralogical origin. Considering all the results for both solids of paste and combined aggregate respectively. Notation k
coarse and fine aggregates are of quartzite origin, the average and V are used for conductivity and volume fraction of materials.
conductivity of solid is 5.0 W/m.K for a w/c of 0.64. The k s for
paste is 1.40 W/m.K, but that for aggregate is higher, hence k s 0.8
is expected to vary with volumetric paste content. Average of 0.7 1/k = 0.488Vp + 0.2075
s
the k s values of concrete over three (20 °C, 40 °C, and 60 °C) 0.6 R² = 0.9778
temperatures are plotted for various paste contents in Figure 20.
The plot clearly depicts a decreasing trend of k s of concrete 0.5
with paste content as paste has lower conductivity of solid. Both 1/k s (1/conductivity of solid) 0.4
linear and quadratic trend lines fit very well. The k s of concrete 0.3
have two components, solid conductivity of paste and solid
conductivity of combined aggregates. 0.2
0.1
The order of these two conductivities of solids is similar.
Pores are present at the interface and in paste. In concrete 0 0 0.2 0.4 0.6 0.8 1 1.2
aggregates and pore free solid of pastes are likely to be Volumetric paste content fraction
randomly distributed and combination of series and parallel Figure 21: 1/k s of concrete against volumetric paste content
THE INDIAN CONCRETE JOURNAL | JANUARY 2026 25