
Page 19 - ICJ Jan 2026
P. 19
TECHNICAL PAPER
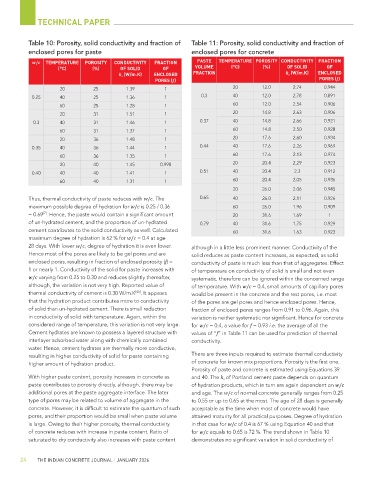
Table 10: Porosity, solid conductivity and fraction of Table 11: Porosity, solid conductivity and fraction of
enclosed pores for paste enclosed pores for concrete
w/c TEMPERATURE POROSITY CONDUCTIVITY FRACTION PASTE TEMPERATURE POROSITY CONDUCTIVITY FRACTION
(°C) (%) OF SOLID OF VOLUME (°C) (%) OF SOLID OF
k s (W/m.K) ENCLOSED FRACTION k s (W/m.K) ENCLOSED
PORES (f) PORES (f)
20 25 1.39 1 20 12.0 2.74 0.944
0.25 40 25 1.36 1 0.3 40 12.0 2.78 0.891
60 25 1.28 1 60 12.0 2.54 0.906
20 31 1.51 1 20 14.8 2.63 0.906
0.3 40 31 1.46 1 0.37 40 14.8 2.66 0.921
60 31 1.37 1 60 14.8 2.50 0.928
20 36 1.48 1 20 17.6 2.60 0.934
0.35 40 36 1.44 1 0.44 40 17.6 2.26 0.969
60 36 1.35 1 60 17.6 2.13 0.974
20 40 1.45 0.998 20 20.4 2.29 0.923
0.40 40 40 1.41 1 0.51 40 20.4 2.3 0.912
60 40 1.31 1 60 20.4 2.05 0.936
20 26.0 2.06 0.945
Thus, thermal conductivity of paste reduces with w/c. The 0.65 40 26.0 2.11 0.926
maximum possible degree of hydration for w/c is 0.25 / 0.36 60 26.0 1.96 0.909
= 0.69 . Hence, the paste would contain a significant amount 20 31.6 1.69 1
[7]
of un-hydrated cement, and the proportion of un-hydrated 0.79 40 31.6 1.75 0.929
cement contributes to the solid conductivity as well. Calculated 60 31.6 1.63 0.923
maximum degree of hydration is 62 % for w/c = 0.4 at age
28 days. With lower w/c, degree of hydration h is even lower. although in a little less prominent manner. Conductivity of the
Hence most of the pores are likely to be gel pores and are solid reduces as paste content increases, as expected, as solid
enclosed pores, resulting in fraction of enclosed porosity (f) = conductivity of paste is much less than that of aggregates. Effect
1 or nearly 1. Conductivity of the solid for paste increases with of temperature on conductivity of solid is small and not even
w/c varying from 0.25 to 0.30 and reduces slightly thereafter, systematic, therefore can be ignored within the concerned range
although, the variation is not very high. Reported value of of temperature. With w/c = 0.4, small amounts of capillary pores
thermal conductivity of cement is 0.30 W/m.K . It appears would be present in the concrete and the rest pores, i.e. most
[45]
that the hydration product contributes more to conductivity of the pores are gel pores and hence enclosed pores. Hence,
of solid than un-hydrated cement. There is small reduction fraction of enclosed pores ranges from 0.91 to 0.96. Again, this
in conductivity of solid with temperature. Again, within the variation is neither systematic nor significant. Hence for concrete
considered range of temperature, this variation is not very large. for w/c = 0.4, a value for f = 0.93 i.e. the average of all the
Cement hydrates are known to possess a layered structure with values of “f” in Table 11 can be used for prediction of thermal
interlayer adsorbed water along with chemically combined conductivity.
water. Hence, cement hydrates are thermally more conductive,
resulting in higher conductivity of solid for paste containing There are three inputs required to estimate thermal conductivity
higher amount of hydration product. of concrete for known mix proportions. Porosity is the first one.
Porosity of paste and concrete is estimated using Equations 39
With higher paste content, porosity increases in concrete as and 40. The k s of Portland cement paste depends on quantum
paste contributes to porosity directly, although, there may be of hydration products, which in turn are again dependent on w/c
additional pores at the paste aggregate interface. The later and age. The w/c of normal concrete generally ranges from 0.25
type of pores may be related to volume of aggregate in the to 0.55 or up to 0.65 at the most. The age of 28 days is generally
concrete. However, it is difficult to estimate the quantum of such acceptable as the time when most of concrete would have
pores, and their proportion would be small when paste volume attained maturity for all practical purposes. Degree of hydration
is large. Owing to their higher porosity, thermal conductivity in that case for w/c of 0.4 is 67 % using Equation 40 and that
of concrete reduces with increase in paste content. Ratio of for w/c equals to 0.65 is 72 %. The trend shown in Table 10
saturated to dry conductivity also increases with paste content demonstrates no significant variation in solid conductivity of
24 THE INDIAN CONCRETE JOURNAL | JANUARY 2026