
Page 18 - ICJ Jan 2026
P. 18
TECHNICAL PAPER
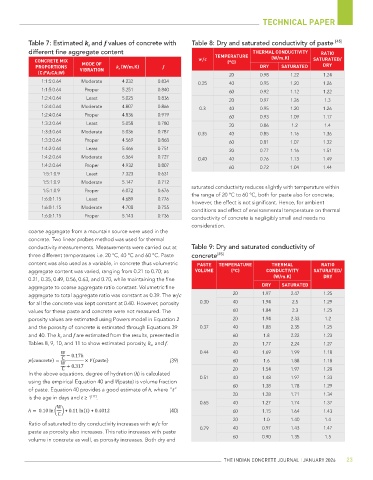
Table 7: Estimated k and f values of concrete with Table 8: Dry and saturated conductivity of paste [45]
s
different fine aggregate content TEMPERATURE THERMAL CONDUCTIVITY RATIO
CONCRETE MIX MODE OF w/c (°C) (W/m.K) SATURATED/
PROPORTIONS VIBRATION k s (W/m.K) f DRY SATURATED DRY
(C:FA:CA:W) 20 0.98 1.22 1.24
1:1:5:0.64 Moderate 4.232 0.834 0.25 40 0.95 1.20 1.26
1:1:5:0.64 Proper 5.251 0.840 60 0.92 1.12 1.22
1:2:4:0.64 Least 5.025 0.836 20 0.97 1.26 1.3
1:2:4:0.64 Moderate 4.807 0.866 0.3 40 0.95 1.20 1.26
1:2:4:0.64 Proper 4.836 0.919 60 0.93 1.09 1.17
1:3:3:0.64 Least 5.058 0.780 20 0.86 1.2 1.4
1:3:3:0.64 Moderate 5.036 0.787 0.35 40 0.85 1.16 1.36
1:3:3:0.64 Proper 4.569 0.868 60 0.81 1.07 1.32
1:4:2:0.64 Least 5.466 0.751 20 0.77 1.16 1.51
1:4:2:0.64 Moderate 6.564 0.727 0.40 40 0.76 1.13 1.49
1:4:2:0.64 Proper 4.932 0.807 60 0.72 1.04 1.44
1:5:1:0.9 Least 7.323 0.631
1:5:1:0.9 Moderate 5.147 0.712
saturated conductivity reduces slightly with temperature within
1:5:1:0.9 Proper 6.072 0.676
the range of 20 °C to 60 °C, both for paste also for concrete;
1:6:0:1.15 Least 4.689 0.776
however, the effect is not significant. Hence, for ambient
1:6:0:1.15 Moderate 4.708 0.755
conditions and effect of environmental temperature on thermal
1:6:0:1.15 Proper 5.143 0.736 conductivity of concrete is negligibly small and needs no
consideration.
coarse aggregate from a mountain source were used in the
concrete. Two linear probes method was used for thermal
conductivity measurements. Measurements were carried out at Table 9: Dry and saturated conductivity of
three different temperatures i.e. 20 °C, 40 °C and 60 °C. Paste concrete [45]
content was also used as a variable, in concrete thus volumetric PASTE TEMPERATURE THERMAL RATIO
aggregate content was varied, ranging from 0.21 to 0.70; as VOLUME (°C) CONDUCTIVITY SATURATED/
0.21, 0.35, 0.49, 0.56, 0.63, and 0.70, while maintaining the fine (W/m.K) DRY
aggregate to coarse aggregate ratio constant. Volumetric fine DRY SATURATED
aggregate to total aggregate ratio was constant as 0.39. The w/c 20 1.97 2.47 1.25
for all the concrete was kept constant at 0.40. However, porosity 0.30 40 1.94 2.5 1.29
values for these paste and concrete were not measured. The 60 1.84 2.3 1.25
porosity values are estimated using Powers model in Equation 2 20 1.94 2.33 1.2
and the porosity of concrete is estimated through Equations 39 0.37 40 1.88 2.35 1.25
and 40. The k s and f are estimated from the results, presented in 60 1.8 2.22 1.23
Tables 8, 9, 10, and 11 to show estimated porosity, k s , and f. 20 1.77 2.24 1.27
0.44 40 1.69 1.99 1.18
(39) 60 1.6 1.88 1.18
20 1.54 1.97 1.28
In the above equations, degree of hydration (h) is calculated 0.51 40 1.48 1.97 1.33
using the empirical Equation 40 and V(paste) is volume fraction
of paste. Equation 40 provides a good estimate of h, where “t” 60 1.38 1.78 1.29
20 1.28 1.71 1.34
[17]
is the age in days and t ≥ 1 .
0.65 40 1.27 1.74 1.37
(40) 60 1.15 1.64 1.43
20 1.0 1.40 1.4
Ratio of saturated to dry conductivity increases with w/c for
0.79 40 0.97 1.43 1.47
paste as porosity also increases. This ratio increases with paste
volume in concrete as well, as porosity increases. Both dry and 60 0.90 1.35 1.5
THE INDIAN CONCRETE JOURNAL | JANUARY 2026 23