
Page 10 - ICJ Feb Openaccess 2026
P. 10
TECHNICAL PAPER
Stage I: Initial response
dominated by the matrix.
State II: Multiple cracking of
the matrix
State III: Cracks open.
Load carried by the textile
filaments until rupture
Figure 12. Typical stress-strain response of TRC [48] showing strain- Figure 14: Transition in the stress-strain response with increasing textile
hardening response volume fraction in TRC
manufacturing. Choosing the maximum aggregate size and due to in-plane bending and load eccentricity. In contrast,
the flowability of the matrix are important, along with providing rotating-end conditions enabled specimen self-alignment,
spacers between the textile layers, so that the TRC has uniform resulting in symmetric crack development.
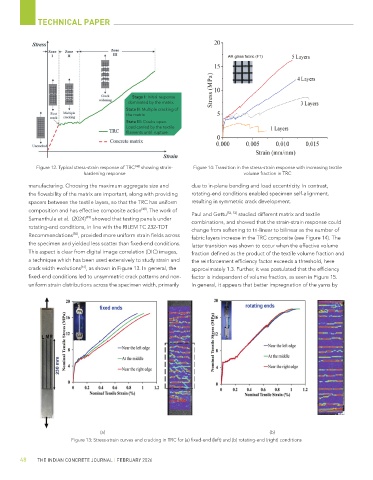
composition and has effective composite action . The work of Paul and Gettu [52, 53] studied different matrix and textile
[48]
Samanthula et al. (2024) showed that testing panels under combinations, and showed that the strain-strain response could
[49]
rotating-end conditions, in line with the RILEM TC 232-TDT
change from softening to tri-linear to bilinear as the number of
Recommendations , provided more uniform strain fields across
[50]
fabric layers increase in the TRC composite (see Figure 14). The
the specimen and yielded less scatter than fixed-end conditions. latter transition was shown to occur when the effective volume
This aspect is clear from digital image correlation (DIC) images, fraction defined as the product of the textile volume fraction and
a technique which has been used extensively to study strain and the reinforcement efficiency factor exceeds a threshold, here
[51]
crack width evolutions , as shown in Figure 13. In general, the approximately 1.3. Further, it was postulated that the efficiency
fixed-end conditions led to unsymmetric crack patterns and non- factor is independent of volume fraction, as seen in Figure 15.
uniform strain distributions across the specimen width, primarily In general, it appears that better impregnation of the yarns by
(a) (b)
Figure 13: Stress-strain curves and cracking in TRC for (a) fixed-end (left) and (b) rotating-end (right) conditions
48 THE INDIAN CONCRETE JOURNAL | FEBRUARY 2026