
Page 7 - ICJ Feb Openaccess 2026
P. 7
TECHNICAL PAPER
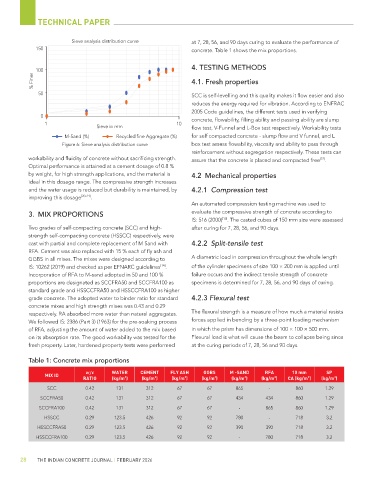
Sieve analysis distribution curve at 7, 28, 56, and 90 days curing to evaluate the performance of
150 concrete. Table 1 shows the mix proportions.
100 4. TESTING METHODS
% Finer 4.1. Fresh properties
50 SCC is self-levelling and this quality makes it flow easier and also
reduces the energy required for vibration. According to ENFRAC
2005 Code guidelines, the different tests used in verifying
0 concrete, flowability, filling ability and passing ability are slump
1 10
Sieve in mm flow test, V-Funnel and L-Box test respectively. Workability tests
M-Sand (%) Recycled fine Aggregate (%) for self compacted concrete - slump flow and V funnel, and L
Figure 6: Sieve analysis distribution curve box test assess flowability, viscosity and ability to pass through
reinforcement without segregation respectively. These tests can
workability and fluidity of concrete without sacrificing strength. assure that the concrete is placed and compacted free .
[22]
Optimal performance is attained at a cement dosage of 0.8 %
by weight, for high strength applications, and the material is 4.2 Mechanical properties
ideal in this dosage range. The compressive strength increases
and the water usage is reduced but durability is maintained, by 4.2.1 Compression test
improving this dosage [20-21] .
An automated compression testing machine was used to
evaluate the compressive strength of concrete according to
3. MIX PROPORTIONS
IS: 516 (2000) . The casted cubes of 150 mm size were assessed
[15]
Two grades of self-compacting concrete (SCC) and high- after curing for 7, 28, 56, and 90 days.
strength self-compacting concrete (HSSCC) respectively, were
cast with partial and complete replacement of M Sand with 4.2.2 Split-tensile test
RFA. Cement was also replaced with 15 % each of fly ash and
GGBS in all mixes. The mixes were designed according to A diametric load in compression throughout the whole length
[14]
IS: 10262 (2019) and checked as per EFNARC guidelines . of the cylinder specimens of size 100 × 200 mm is applied until
Incorporation of RFA to M-sand adopted in 50 and 100 % failure occurs and the indirect tensile strength of concrete
proportions are designated as SCCFRA50 and SCCFRA100 as specimens is determined for 7, 28, 56, and 90 days of curing.
standard grade and HSSCCFRA50 and HSSCCFRA100 as higher
grade concrete. The adopted water to binder ratio for standard 4.2.3 Flexural test
concrete mixes and high strength mixes was 0.43 and 0.29
respectively. RA absorbed more water than natural aggregates. The flexural strength is a measure of how much a material resists
We followed IS: 2386 (Part 3) (1963) for the pre-soaking process forces applied in bending by a three-point loading mechanism
of RFA, adjusting the amount of water added to the mix based in which the prism has dimensions of 100 × 100 × 500 mm.
on its absorption rate. The good workability was tested for the Flexural load is what will cause the beam to collapse being since
fresh property. Later, hardened property tests were performed at the curing periods of 7, 28, 56 and 90 days.
Table 1: Concrete mix proportions
w/c WATER CEMENT FLY ASH GGBS M -SAND RFA 10 mm SP
MIX ID
3
3
3
3
3
3
3
3
RATIO (kg/m ) (kg/m ) (kg/m ) (kg/m ) (kg/m ) (kg/m ) CA (kg/m ) (kg/m )
SCC 0.42 131 312 67 67 865 - 860 1.29
SCCFRA50 0.42 131 312 67 67 434 434 860 1.29
SCCFRA100 0.42 131 312 67 67 - 865 860 1.29
HSSCC 0.29 123.5 426 92 92 780 - 718 3.2
HSSCCFRA50 0.29 123.5 426 92 92 390 390 718 3.2
HSSCCFRA100 0.29 123.5 426 92 92 - 780 718 3.2
28 THE INDIAN CONCRETE JOURNAL | FEBRUARY 2026