
Page 11 - ICJ Feb Openaccess 2026
P. 11
TECHNICAL PAPER
0.8 0.68 0.61 0.7 0.63 0.69 0.6 0.67 0.59 0.68 0.58 0.7 0.6 6 y = 0.0786x + 0.532
Tensile strength ratio 0.6 0.44 0.46 0.44 0.53 0.54 0.55 5 4 R² = 0.9932 SCCFRA100 HSSCCFRA50
0.7
HSSCC
0.5
0.4
0.3
SCCFRA50
0.2
SCC
0.1
0 Tensile strength, MPa 3 2 SCCFRA100
SCCFRA50 SCCFRA100 HSSCCFRA50 HSSCCFRA100 1
SCC HSSCC
MIX ID 0 0 10 20 30 40 50 60 70
7days/28 days 7days/56 days 7days/90 days Compressive strength, MPa
Figure 12(b): Plot of tensile strength ratios Figure 12(c): Compressive Strength vs Tensile Strength
Figure 12(b) shows the details of the ratio of Tensile strength free water content in RFA than the nominal mix which results in
at various ages to the 7day Tensile strength for different a porous microstructure . Moreover, some SEM images depict
[29]
percentage replacement of RFA and M-Sand. new treated cement paste while other micrographs show old
adhered cement paste where the cement matrix exhibits poor
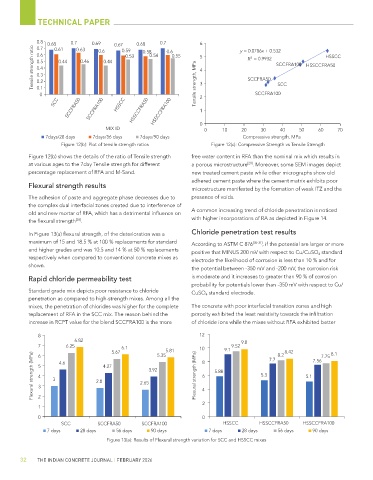
Flexural strength results microstructure manifested by the formation of weak ITZ and the
The adhesion of paste and aggregate phase decreases due to presence of voids.
the complex dual interfacial zones created due to interference of
old and new mortar of RFA, which has a detrimental influence on A common increasing trend of chloride penetration is noticed
[28]
the flexural strength . with higher incorporations of RA as depicted in Figure 14.
In Figure 13(a) flexural strength, of the deterioration was a Chloride penetration test results
maximum of 15 and 18.5 % at 100 % replacements for standard According to ASTM C 876 [30-31] , if the potential are larger or more
and higher grades and was 10.5 and 14 % at 50 % replacements positive that MINUS 200 mV with respect to Cu/CuSO 4 standard
respectively when compared to conventional concrete mixes as electrode the likelihood of corrosion is less than 10 % and for
shown.
the potential between -350 mV and -200 mV, the corrosion risk
Rapid chloride permeability test is moderate and it increases to greater than 90 % of corrosion
probability for potentials lower than -350 mV with respect to Cu/
Standard grade mix depicts poor resistance to chloride CuSO 4 standard electrode.
penetration as compared to high-strength mixes. Among all the
mixes, the penetration of chlorides was higher for the complete The concrete with poor interfacial transition zones and high
replacement of RFA in the SCC mix. The reason behind the porosity exhibited the least resistivity towards the infiltration
increase in RCPT value for the blend SCCFRA100 is the more of chloride ions while the mixes without RFA exhibited better
8 12
6.82 9.8
7 6 6.25 5.67 6.1 5.35 5.81 10 9.1 9.52 7.7 8.2 8.42 7.56 7.75 8.1
Flexural strength (MPa) 5 4 3 3 4.6 2.8 4.27 2.65 3.92 Flexural strength (MPa) 8 6 4 5.88 5.3 5.1
2
2
1
0 0
SCC SCCFRA50 SCCFRA100 HSSCC HSSCCFRA50 HSSCCFRA100
7 days 28 days 56 days 90 days 7 days 28 days 56 days 90 days
Figure 13(a): Results of Flexural strength variation for SCC and HSSCC mixes
32 THE INDIAN CONCRETE JOURNAL | FEBRUARY 2026