
Page 15 - ICJ Feb Openaccess 2026
P. 15
TECHNICAL PAPER
They highlight the need to quantify deterioration rates to make Table 2: Experimental results of slope dc/dt and
service life predictions accurate and to manage the lifecycle of diffusion coefficients determined based on Fick’s
the structure to optimize maintenance and repair. Service life Second Law using the procedure described in NT
design is surrounded by limit states. Structural integrity is what it Build 443
aims to address under the maximum expected load that the ULS
-8
-13
dc/dt (x10 )
2
processes, the SLS also accomplishes functionality of the metal MIXES (m.mol/cm .s) D(x10 ) (m /s)
3
while the DLS does it to prevent the material from decaying to
the point of it losing its length. Model codes based on durability SCC 1.2 2.67
design standards like ISO 13823 proscribe the use of models SCCFRA50 2 4.56
that can realistically predict deterioration and meet specified SCCFRA100 3.05 6.77
reliability levels. There are also standards such as ISO 13823
HSSCC 7.3 1.62
and the fib Model Code for service life design which integrate
probabilistic and deterministic approaches for SLP, ranging from HSSCCFRA50 1.03 2.3
a full probabilistic analysis to partial factor design and finally the HSSCCFRA100 1.45 3.22
deemed-to-satisfy approach. These engineer standards quantify
performance in terms of metrics that are used to evaluate The diffusion coefficient for service life estimation was found
durability based on calibrated field and lab data and guide experimentally by diffusion cell method which allowed to
engineers to design for a specified time duration [36-37] .
find out the chloride concentration in the sample. Chloride
Previous research indicates that service life methodology penetration is determined from the slope of the curve obtained
considers material degradation, environmental effects and load from a graph drawn between chloride concentration and
[40]
application and calculates structural longevity based on these duration (Table 2) (dc/dt) . In the RCPT, the reservoirs R 1 and
considerations, with concrete structures particularly susceptible R 2 are filled with sodium chloride (NaCl) and sodium hydroxide
to high loads that accelerate chloride penetration and micro solution (NaOH) respectively. The cathode (in chloride solution)
[38]
cracking . Organic concrete coatings increase chloride and the anode (in hydroxide solution) are connected to a D.C
resistance, with immediate strength benefits for infiltrating power pack by applying a 30.0 V voltage, NaCl ionizes and the
coatings, and longer term durability. Simulated aging methods Cl ion gets attracted towards anode as depicted in Figure 21.
are valuable for predicting service life under environmental
stressors accurately . Sample from R 2 is collected and the chloride content by
[39]
argentometric method by volumetric titration in a time interval is
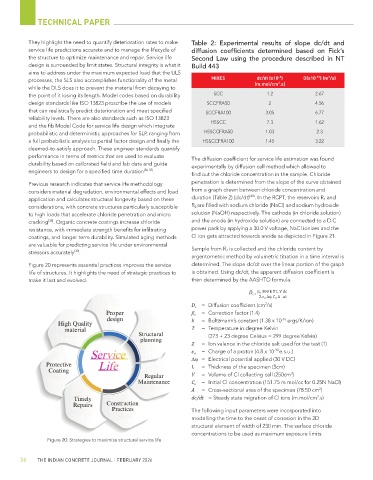
Figure 20 represents essential practices improves the service determined. The slope dc/dt over the linear portion of the graph
life of structures. It highlights the need of strategic practices to is obtained. Using dc/dt, the apparent diffusion coefficient is
make it last and evolved. then determined by the AASHTO formula.
β 0 300 k T L V dc
D c =
Z e 0 Δψ C 0 A dt
2
D c = Diffusion coefficient (cm /s)
β o = Correction factor (1.4)
-16
k = Boltzmann’s constant (1.38 x 10 ergs/K/ion)
T = Temperature in degree Kelvin
(273 + 23 degree Celsius = 299 degree Kelvin)
Z = Ion valance in the chloride salt used for the test (1)
-10
e o = Charge of a proton (4.8 x 10 e.s.u.)
∆ψ = Electrical potential applied (30 V DC)
L = Thickness of the specimen (5cm)
3
V = Volume of Cl collecting cell (250cm )
C o = Initial Cl concentration (151.75 m mol/cc for 0.25N NaCl)
2
A = Cross-sectional area of the specimen (78.50 cm )
3
dc/dt = Steady state migration of Cl ions (m.mol/cm .s)
The following input parameters were incorporated into
modelling the time to the onset of corrosion in the 2D
structural element of width of 230 mm. The surface chloride
concentrations to be used as maximum exposure limits
Figure 20: Strategies to maximize structural service life
36 THE INDIAN CONCRETE JOURNAL | FEBRUARY 2026