Page 16 - ICJ Feb Openaccess 2026
P. 16

TECHNICAL PAPER


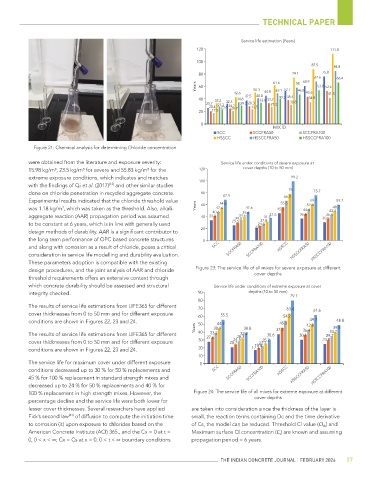
                                                                                  Service life estimation (Years)
                                                                   120                                          111.8
                                                                   100
                                                                                                          87.5
                                                                                                                  84.8
                                                                    80                              74.1      75.8
                                                                                                           67.6    66.4
                                                                                                       60.9
                                                                   Years  60          50.3   61.6  52.7  58  53.8  52.6
                                                                                42.6   40.8  44.8  49.1  46.8  43.6  41.5
                                                                    40   33.2    34.8  37.5  33.8 33.2  40.3  38.4  34.8
                                                                       25.7  27.7  32.3  29.3  28.3  27.2  30.8
                                                                        20.4  23.6  24.7  23.5
                                                                               20.7
                                                                    20  17.5
                                                                     0
                                                                                             MIX ID
                                                                          SCC         SCCFRA50         SCCFRA100
                                                                          HSSCC       HSSCCFRA50       HSSCCFRA100
            Figure 21: Chemical analysis for determining Chloride concentration


           were obtained from the literature and exposure severity:         Service life under conditions of severe exposure at
           15.98 kg/m³, 23.5 kg/m³ for severe and 55.83 kg/m³ for the   120        cover depths (10 to 50 mm)
           extreme exposure conditions, which indicates and matches                                99.2
                                                                    100
                                      [12]
           with the findings of Qi et al. (2017)  and other similar studies
                                                                                                  78
           done on chloride penetration in recycled aggregate concrete.   80                               75.7
                                                                            67.9                 66.5
           Experimental results indicated that the chloride threshold value   54.8              55.5      60.7    59.7
                                                                                                        52.4
           was 1.18 kg/m , which was taken as the threshold. Also, alkali-  Years  60  47.6  47.6  45.5  44.4    48.7
                      3
                                                                         40.6      39.4                         42.5
                                                                                                               36.4
           aggregate reaction (AAR) propagation period was assumed   40  33.8   29.8      31.5 37.5   36.8    30.5
                                                                                  34.6
                                                                               25.5      27.8
           to be constant at 6 years, which is in line with generally used              24.5
                                                                     20                21
           design methods of durability. AAR is a significant contributor to
           the long term performance of OPC based concrete structures   0
           and along with corrosion as a result of chloride, poses a critical   SCC  SCCFRA50  SCCFRA100  HSSCC
           consideration in service life modelling and durability evaluation.                      HSSCCFRA50  HSSCCFRA100
           These parameters adoption is compatible with the existing
           design procedures, and the joint analysis of AAR and chloride   Figure 23: The service life of all mixes for severe exposure at different
                                                                                       cover depths
           threshold requirements offers an extensive context through
           which concrete durability should be assessed and structural   Service life under conditions of extreme exposure at cover
           integrity checked.                                       90               depths (10 to 50 mm)
                                                                                                   79.7
                                                                    80
           The results of service life estimations from LIFE365 for different   70                63.4
           cover thicknesses from 0 to 50 mm and for different exposure   60  55.5              54.2       61.6
           conditions are shown in Figures 22, 23 and 24.           50    44.9                 45.5      49.7     48.8
                                                                                                        42.8
                                                                   Years  38.9     38.8       37.2     36.4      39.8
                                                                                                                34.7
                                                                        33.2
           The results of service life estimations from LIFE365 for different   40  27.6  28.3  30.6  30.1     29.7
                                                                                  32.2
                                                                                24.5
           cover thicknesses from 0 to 50 mm and for different exposure   30  20.7     19.8 25.7              24.8
                                                                                        22.7
           conditions are shown in Figures 22, 23 and 24.           20                17.3
                                                                    10
           The service life for maximum cover under different exposure   0
           conditions decreased up to 30 % for 50 % replacements and     SCC  SCCFRA50         HSSCC
           45 % for 100 % replacement in standard strength mixes and                 SCCFRA100     HSSCCFRA50  HSSCCFRA100
           decreased up to 24 % for 50 % replacements and 40 % for
           100 % replacement in high strength mixes. However, the   Figure 24: The service life of all mixes for extreme exposure at different
           percentage decline and the service life were both lower for                 cover depths
           lesser cover thicknesses. Several researchers have applied   are taken into consideration since the thickness of the layer is
                        [41]
           Fick’s second law  of diffusion to compute the initiation time   small, the reaction terms containing Dc and the time derivative
           to corrosion (it) upon exposure to chlorides based on the   of Cs, the model can be reduced. Threshold Cl value (Cl th ) and
           American Concrete Institute (ACI) 365., and the Cx = 0 at t =   Maximum surface Cl concentration (C s ) are known and assuming
           0, 0 < x < ∞; Cx = Cs at x = 0, 0 < t < ∞ boundary conditions   propagation period = 6 years.


                                                                           THE INDIAN CONCRETE JOURNAL | FEBRUARY 2026  37
   11   12   13   14   15   16   17   18   19   20   21