Page 12 - ICJ Feb Openaccess 2026
P. 12

TECHNICAL PAPER


            0.8
                                                                    12
            Flexural strength ratio  0.7  0.66  0.44  0.66 0.5 0.46  0.68 0.5 0.46  0.65 0.62 0.6  0.69  0.63 0.68 0.66  10  y = 0.1707x 1.296  HSSCCFRA50
                                                 0.65
                                                                                                  -
                                                           0.63
            0.6
                                                                                             R² = 0.9754
                  0.48
                                                                                                                HSSCC
            0.5
                                                                     8
            0.4
                                                                                           HSSCCFRA100
            0.3
            0.2
            0.1                                                    Flexural strength ratio  6  SCCFRA50  SCC
             0                                                       4             SCCFRA100
                  SCC                   HSSCC
                       SCCFRA50  SCCFRA100  HSSCCFRA50 HSSCCFRA100   2
                                     MIX ID                          0  0   10     20    30    40     50    60    70
                7days/28 days   7days/56 days   7days/90 days                      Compressive strength, MPa
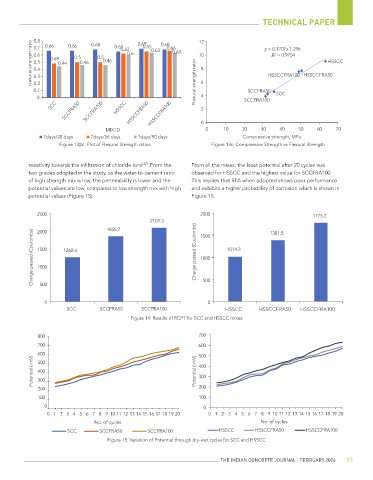
                     Figure 13(b): Plot of Flexural Strength ratios     Figure 13c: Compressive Strength vs Flexural Strength


                                                 [32]
           resistivity towards the infiltration of chloride ions . From the   From all the mixes, the least potential after 20 cycles was
           two grades adopted in the study, as the water-to-cement ratio   observed for HSSCC and the highest value for SCCFRA100.
           of high strength mix is low, the permeability is lower and the   This implies that RFA when adopted shows poor performance
           potential values are low, compared to low strength mix with high   and exhibits a higher probability of corrosion which is shown in
           potential values (Figure 15).                          Figure 15.

              2500                                                   2000                                  1775.2
                                                    2105.3           1500                   1381.8
                                     1855.7
            Charge passed (Coulombs)  1500  1260.6                 Charge passed (Coulombs)  1000  1014.3
              2000


              1000

              500


                0                                                    500
                                                                       0
                       SCC         SCCFRA50      SCCFRA100                   HSSCC      HSSCCFRA50    HSSCCFRA100
                                             Figure 14: Results of RCPT for SCC and HSSCC mixes


              800                                                   700
              700                                                   600
              600                                                   500
            Potential (-mV)  400                                   Potential (-mV)  400
              500

                                                                    300
              300
              200                                                   200
              100                                                   100
                0                                                     0
                 0123456789 10 11 12 13 14 15 16 17 18 19 20           0123456789 10 11 12 13 14 15 16 17 18 19 20
                                 No. of cycles                                           No. of cycles
                        SCC        SCCFRA50        SCCFRA100               HSSCC       HSSCCFRA50       HSSCCFRA100
                                     Figure 15: Variation of Potential through dry-wet cycles for SCC and HSSCC


                                                                           THE INDIAN CONCRETE JOURNAL | FEBRUARY 2026  33
   7   8   9   10   11   12   13   14   15   16   17