
Page 13 - ICJ Feb Openaccess 2026
P. 13
TECHNICAL PAPER
The chloride penetration depth when sprayed with AgNO 3 after
performing split tension for the cubes subject to accelerated
corrosion process shows higher chloride penetration for
complete replacement of M-Sand with RFA than the partial
replacement. This clearly shows that the total porosity of the mix
increases with RFA and weakens the resistance to penetration
which is observed in all the results.
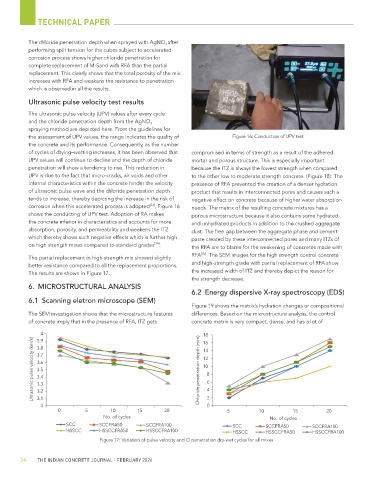
Ultrasonic pulse velocity test results
The ultrasonic pulse velocity (UPV) values after every cycle
and the chloride penetration depth from the AgNO 3
spraying method are depicted here. From the guidelines for
the assessment of UPV values, the range indicates the quality of Figure 16: Conduction of UPV test
the concrete and its performance. Consequently, as the number
of cycles of drying–wetting increases, it has been observed that compromised in terms of strength as a result of the adhered
UPV values will continue to decline and the depth of chloride mortar and porous structure. This is especially important
penetration will show a tendency to rise. This reduction in because the ITZ is always the lowest strength when compared
UPV is due to the fact that micro-cracks, air voids and other to the other low to moderate strength concrete. (Figure 18). The
internal characteristics within the concrete hinder the velocity presence of RFA prevented the creation of a denser hydration
of ultrasonic pulse wave and the chloride penetration depth product that results in interconnected pores and causes such a
tends to increase, thereby depicting the increase in the risk of negative effect on concrete because of higher water absorption
[33]
corrosion when this accelerated process is adopted . Figure 16 needs. The matrix of the resulting concrete mixtures has a
shows the conducting of UPV test. Adoption of RA makes porous microstructure because it also contains some hydrated
the concrete inferior in characteristics and accounts for more and unhydrated products in addition to the crushed aggregate
absorption, porosity, and permeability and weakens the ITZ dust. The free gap between the aggregate phase and cement
which thereby shows such negative effects which is further high paste created by these interconnected pores and many ITZs of
[34]
on high strength mixes compared to standard grades . the RFA are to blame for the weakening of concretes made with
RFA . The SEM images for the high strength control concrete
[35]
The partial replacement in high strength mix showed slightly
better resistance compared to all the replacement proportions. and high-strength grade with partial replacement of RFA show
The results are shown in Figure 17. the increased width of ITZ and thereby depict the reason for
the strength decrease.
6. MICROSTRUCTURAL ANALYSIS
6.2 Energy dispersive X-ray spectroscopy (EDS)
6.1 Scanning eletron microscope (SEM)
Figure 19 shows the matrix’s hydration changes or compositional
The SEM investigation shows that the microstructure features differences. Based on the microstructure analysis, the control
of concrete imply that in the presence of RFA, ITZ gets concrete matrix is very compact, dense, and has a lot of
4 16
Ultrasonic pulse velocity (km/s) 3.7 Chloride penetration depth (mm) 18 8 6
3.9
3.8
14
12
3.6
10
3.5
3.4
3.3
3.2
3.1
3 4 2 0
0 5 10 15 20 5 10 15 20
No. of cycles No. of cycles
SCC SCCFRA50 SCCFRA100 SCC SCCFRA50 SCCFRA100
HSSCC HSSCCFRA50 HSSCCFRA100 HSSCC HSSCCFRA50 HSSCCFRA100
Figure 17: Variation of pulse velocity and Cl penetration dry-wet cycles for all mixes
34 THE INDIAN CONCRETE JOURNAL | FEBRUARY 2026