Page 10 - ICJ Feb Openaccess 2026
P. 10

TECHNICAL PAPER


             50           46.7                                      80
                                                                                  71
                       42.4        32.5  37 41.5      34.6 38.3     70     63.4  66.7         53.2  57.8      52  55.5
            Compressive  strength (MPa)  30  24.2  22.11  21.2 31.4  Compressive  strength (MPa)  50  36.5  29.1 50.7  30.5 49.2
             40
                     36
                                                                    60
                                                                    40
             20
                                                                    30
                                                                    20
             10

                                                                     0
              0                                                     10
                      SCC          SCCFRA50       SCCFRA100                 HSSCC        HSSCCFRA50     HSSCCFRA100
                 7 days     28 days     56 days     90 days             7 days     28 days     56 days     90 days
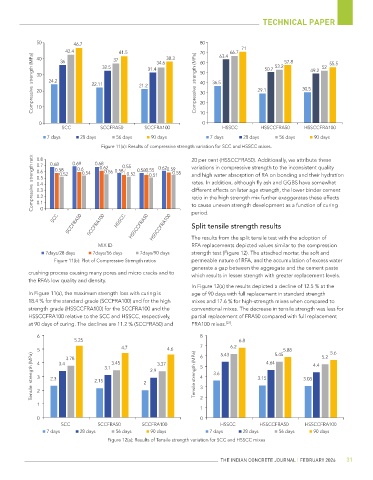
                                   Figure 11(a): Results of compressive strength variation for SCC and HSSCC mixes.
            Compressive  strength ratio  0.7  0.58  0.6 0.54  0.62  0.58 0.55  0.580.55  0.62 0.59  variations in compressive strength to the inconsistent quality
             0.8
                                                                  20 per cent (HSSCCFRA50). Additionally, we attribute these
                                 0.68
                         0.69
                  0.68
                                    0.56
             0.6
                                                           0.55
                                            0.52
                     0.52
                                                   0.51
                                                                  and high water absorption of RA on bonding and their hydration
             0.5
                                                                  rates. In addition, although fly ash and GGBS have somewhat
             0.4
                                                                  different effects on later age strength, the lower binder cement
             0.3
             0.2
                                                                  ratio in the high strength mix further exaggerates these effects
             0.1
               0
                                                                  period.
                        SCCFRA50  SCCFRA100  HSSCCFRA50  HSSCCFRA100  Split tensile strength results
                   SCC                  HSSCC                     to cause uneven strength development as a function of curing
                                                                  RFA replacements depicted values similar to the compression
                                  MIX ID                          The results from the split tensile test with the adoption of
                7days/28 days   7days/56 days   7days/90 days     strength test (Figure 12). The attached mortar, the soft and
                   Figure 11(b): Plot of Compressive Strength ratios  permeable nature of RFA, and the accumulation of excess water
                                                                  generate a gap between the aggregate and the cement paste
           crushing process causing many pores and micro cracks and to   which results in lesser strength with greater replacement levels.
           the RFA’s low quality and density.
                                                                  In Figure 12(a) the results depicted a decline of 12.5 % at the
           In Figure 11(a), the maximum strength loss with curing is   age of 90 days with full replacement in standard strength
           18.4 % for the standard grade (SCCFRA100) and for the high   mixes and 17.6 % for high-strength mixes when compared to
           strength grade (HSSCCFRA100) for the SCCFRA100 and the   conventional mixes. The decrease in tensile strength was less for
           HSSCCFRA100 relative to the SCC and HSSCC, respectively,   partial replacement of FRA50 compared with full replacement
                                                                             [27]
           at 90 days of curing. The declines are 11.2 % (SCCFRA50) and   FRA100 mixes. .
              6                                                      8
                          5.25                                                    6.8
                                          4.7                        7         6.2
              5        3.78            3.45              4.6         6     5.43            4.64 5.45 5.88     5.2  5.6
            Tensile  strength (MPa)  4 3  2.3  3.4  2.15  3.1  2  2.9 3.37  Tensile strength (MPa)  5 4 3  3.6  3.15  3.08  4.4


              1 2                                                    2
                                                                     1
              0                                                      0
                      SCC         SCCFRA50       SCCFRA100                 HSSCC         HSSCCFRA50     HSSCCFRA100
                 7 days     28 days     56 days     90 days             7 days     28 days     56 days     90 days
                                     Figure 12(a): Results of Tensile strength variation for SCC and HSSCC mixes


                                                                           THE INDIAN CONCRETE JOURNAL | FEBRUARY 2026  31
   5   6   7   8   9   10   11   12   13   14   15