
Page 9 - ICJ Feb Openaccess 2026
P. 9
TECHNICAL PAPER
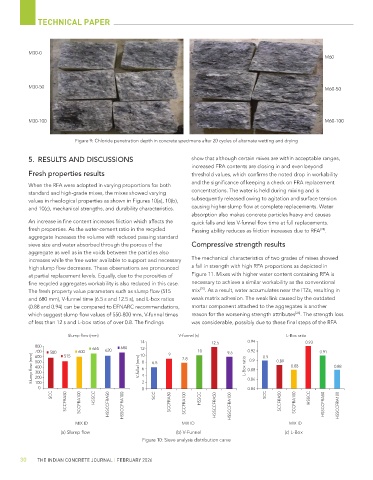
M30-0
M60
M30-50 M60-50
M30-100 M60-100
Figure 9: Chloride penetration depth in concrete specimens after 20 cycles of alternate wetting and drying
5. RESULTS AND DISCUSSIONS show that although certain mixes are within acceptable ranges,
increased FRA contents are closing in and even beyond
Fresh properties results threshold values, which confirms the noted drop in workability
and the significance of keeping a check on FRA replacement
When the RFA were adopted in varying proportions for both
standard and high-grade mixes, the mixes showed varying concentrations. The water is held during mixing and is
values in rheological properties as shown in Figures 10(a), 10(b), subsequently released owing to agitation and surface tension
and 10(c), mechanical strengths, and durability characteristics. causing higher slump flow at complete replacements. Water
absorption also makes concrete particles heavy and causes
An increase in fine content increases friction which affects the quick falls and less V-funnel flow time at full replacements.
fresh properties. As the water-cement ratio in the recycled Passing ability reduces as friction increases due to RFA .
[24]
aggregate increases the volume with reduced passing standard
sieve size and water absorbed through the porous of the Compressive strength results
aggregate as well as in the voids between the particles also
increases while the free water available to support and necessary The mechanical characteristics of two grades of mixes showed
high slump flow decreases. These observations are pronounced a fall in strength with high RFA proportions as depicted in
at partial replacement levels. Equally, due to the porosities of Figure 11. Mixes with higher water content containing RFA is
fine recycled aggregates workability is also reduced in this case. necessary to achieve a similar workability as the conventional
[25]
The fresh property value parameters such as slump flow (515 mix . As a result, water accumulates near the ITZs, resulting in
and 680 mm), V-funnel time (6.5 s and 12.5 s), and L-box ratios weak matrix adhesion. The weak link caused by the outdated
(0.88 and 0.94) can be compared to EFNARC recommendations, mortar component attached to the aggregates is another
[26]
which suggest slump flow values of 550-800 mm, V-funnel times reason for the worsening strength attributes . The strength loss
of less than 12 s and L-box ratios of over 0.8. The findings was considerable, possibly due to these final steps of the RFA
Slump flow (mm) V-funnel (s) L-Box ratio
14 12.5 0.94 0.93
800 665 680 12
700 580 515 600 620 10 9 7.8 10 9.6 0.92 0.9 0.91
Slump flow (mm) 500 V-fullel (mm) 8 6 4 6.5 L-Box ratio 0.88 0.89 0.88 0.88
600
0.9
400
300
200
100
0 2 0 0.86
0.84
SCC HSSCC SCC SCC HSSCC
SCCFRA50 SCCFRA100 HSSCCFRA50 HSSCCFRA100 SCCFRA50 SCCFRA100 HSSCC HSSCCFRA50 HSSCCFRA100 SCCFRA50 SCCFRA100 HSSCCFRA50 HSSCCFRA100
MIX ID MIX ID MIX ID
(a) Slump flow (b) V-Funnel (c) L-Box
Figure 10: Sieve analysis distribution curve
30 THE INDIAN CONCRETE JOURNAL | FEBRUARY 2026