
Page 7 - ICJ Feb Openaccess 2026
P. 7
TECHNICAL PAPER
two weeks respectively [11,12] . The results of mixes A, B, C, and D 4. RESULTS AND DISCUSSION
of GPCT were compared with the results of mixes E, F, G, and H
of GPCA, as well as mixes I, J, K, and L of CC. The results of mix The weight loss and compressive strength of specimen has
A were compared with mixes E and I, while the results of mix B been measured after exposure periods of one week, four weeks,
were compared with mixes F and J. Similarly, the results of mix eight weeks, twelve weeks, twenty-four week, thirty-six week
C were compared with mixes G and K, and the results of mix D and fifty-two weeks respectively. For measuring the weight loss
were compared with mixes H and L. / gain due to acid attack and sulphate attack the electronic
weighing balance of capacity 10 kg having least count 1.0
gram is used. The weight loss / gain is evaluated by comparing
3. ACID ATTACK AND SULPHATE ATTACK
the current weight of specimens with the weight of the same
TEST
specimen which were before the start of respective test. The
Locally available concentrated sulfuric acid (H 2 SO 4 ) having one average weight loss / gain of the three specimens in acid attack
pH is used to prepare three percent acid solution for acid attack and sulphate attack test are given in Table 5 and 6 respectively.
test. The Sodium Sulphate of 99 % purity is used to prepare The positive value shows the increase in weight and negative
five percentage sodium sulphate solution for sulphate attack value shows the weight loss as compared to weight of specimen
[13]
test . These percentages of acid and sodium sulphate have before the start of test.
been taken from recent literature. Twenty one specimens of each From Table 5, 6 and Figure 6 to Figure 9 it is observed that the
mix for each test have been used to study the acid attack and rate of reduction of weight due to acid attack and sulphate
sulphate attack for different seven periods. For each parameters attack is higher in all the mixes of CC. It is also observed that
tests three specimens are used. For twelve mixes, 252 specimens up to 1 week of exposure the cubes of GPCT, GPCA and CC
st
are used for each test. All specimens of acid attack are kept absorb the surrounding water and weight has been increased
in PVC tank and then three percent acidic water is added in and there is no sign of attack. After 1 week exposure the
st
the tank so as to immerse all the specimens in acid solution. surface erosion has been started. The GPCT produce more
Similarly, the all specimens of sulphate attack are also kept in resistance to erosion due to acid attack as compared to CC. In
PVC tank and then five percent sodium sulphate water is added GPCT and GPCA the rate of reduction of self-weight in both
in the tank so as to immerse all the specimens in this sulphate attack is similar up to eight week exposure, beyond that the
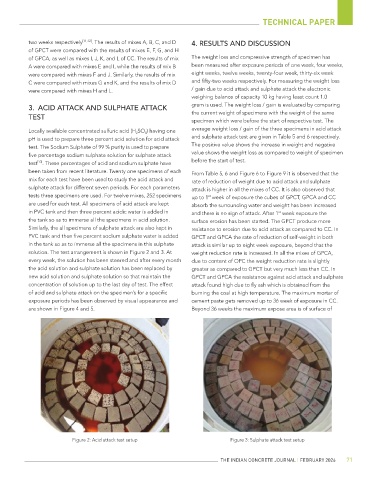
solution. The test arrangement is shown in Figure 2 and 3. At weight reduction rate is increased. In all the mixes of GPCA,
every week, the solution has been steered and after every month due to content of OPC the weight reduction rate is slightly
the acid solution and sulphate solution has been replaced by greater as compared to GPCT but very much less than CC. In
new acid solution and sulphate solution so that maintain the GPCT and GPCA the resistance against acid attack and sulphate
concentration of solution up to the last day of test. The effect attack found high due to fly ash which is obtained from the
of acid and sulphate attack on the specimen’s for a specific burning the coal at high temperature. The maximum mortar of
exposure periods has been observed by visual appearance and cement paste gets removed up to 36 week of exposure in CC.
are shown in Figure 4 and 5. Beyond 36 weeks the maximum expose area is of surface of
Figure 2: Acid attack test setup Figure 3: Sulphate attack test setup
THE INDIAN CONCRETE JOURNAL | FEBRUARY 2026 71