
Page 10 - ICJ Feb Openaccess 2026
P. 10
TECHNICAL PAPER
Table 7: Compressive strength of specimens for various exposure periods of acid attack
COMPRESSIVE STRENGTH (MPa)
WEEKS GPCT GPCA CC
A B C D E F G H I J K L
0 25.73 30.81 36.96 40.59 26.28 30.35 35.93 39.70 25.21 30.78 34.87 40.76
1 25.62 30.63 36.73 40.29 26.19 30.22 35.74 39.44 25.14 30.66 34.66 40.50
4 25.03 29.82 35.54 39.25 24.77 28.47 33.88 37.66 23.89 28.87 32.97 38.28
8 21.81 26.4 32.05 34.71 19.55 22.71 27.83 31.2 17.61 21.71 25.52 29.93
12 17.84 21.61 27.54 29.29 16.3 18.89 23.06 25.98 12.18 15.16 17.66 20.09
24 15.35 17.34 23.18 25.26 14.37 15.12 19.82 20.71 9.0 11.15 12.12 14.53
36 13.06 15.98 19.14 21.76 12.01 13.99 16.62 18.09 7.74 10.15 11.04 12.78
52 12.06 14.23 16.94 19.36 10.34 11.34 12.54 14.34 6.32 8.23 8.79 10.42
Table 8: Compressive strength of specimens for various exposure periods of sulphate attack
COMPRESSIVE STRENGTH (MPa)
WEEKS GPCT GPCA CC
A B C D E F G H I J K L
0 25.73 30.81 36.96 40.59 26.28 30.35 35.93 39.70 25.21 30.78 34.87 40.76
1 25.73 30.81 36.96 40.59 26.28 30.35 35.93 39.70 25.21 30.78 34.87 40.76
4 25.66 30.75 36.9 40.48 26.16 30.27 35.84 39.61 24.98 30.54 34.59 40.45
8 25.57 30.64 36.79 40.35 26.03 30.14 35.71 39.48 24.79 30.3 34.39 40.18
12 25.47 30.5 36.69 40.28 25.92 29.98 35.58 39.35 24.64 30.08 34.12 39.87
24 25.3 30.33 36.51 40.1 25.68 29.67 35.29 38.98 24.31 29.57 33.55 38.94
36 25.16 30.19 36.34 39.94 25.49 29.42 35.09 38.72 24.05 29.17 32.97 38.19
52 24.96 30.01 36.11 39.78 25.26 29.14 35 34.78 38.47 23.75 28.66 32.25 37.17
Compressive Strength (MPa) 30 Compressive Strength (MPa) 30
25
25
20
20
15
15
10
10
5
0
0 10 20 30 40 50 60 5 0 0 10 20 30 40 50 60
Exposure Periods (Weeks) Exposure Periods (Weeks)
A-A A-E A-I A-B A-F A-J
S-E S-A S-I S-B S-F S-J
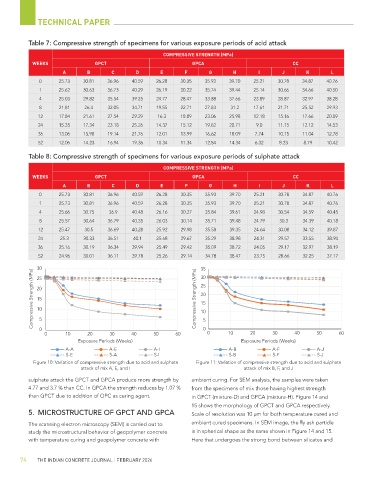
Figure 10: Variation of compressive strength due to acid and sulphate Figure 11: Variation of compressive strength due to acid and sulphate
attack of mix A, E, and I attack of mix B, F, and J
sulphate attack the GPCT and GPCA produce more strength by ambient curing. For SEM analysis, the samples were taken
4.77 and 3.7 % than CC. In GPCA the strength reduces by 1.07 % from the specimens of mix those having highest strength
than GPCT due to addition of OPC as curing agent. in GPCT (mixture-D) and GPCA (mixture-H). Figure 14 and
15 shows the morphology of GPCT and GPCA respectively.
5. MICROSTRUCTURE OF GPCT AND GPCA Scale of resolution was 10 µm for both temperature cured and
The scanning electron microscopy (SEM) is carried out to ambient cured specimens. In SEM image, the fly ash particle
study the microstructural behavior of geopolymer concrete is in spherical shape as the same shown in Figure 14 and 15.
with temperature curing and geopolymer concrete with Here that undergoes the strong bond between silicates and
74 THE INDIAN CONCRETE JOURNAL | FEBRUARY 2026