Page 9 - ICJ Feb Openaccess 2026
P. 9

TECHNICAL PAPER


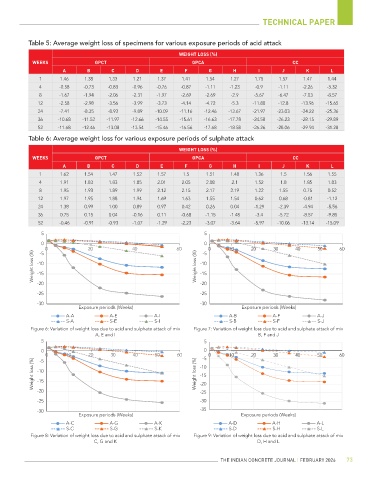
           Table 5: Average weight loss of specimens for various exposure periods of acid attack

                                                             WEIGHT LOSS (%)
            WEEKS                GPCT                             GPCA                              CC
                      A       B        C       D       E       F       G        H       I       J       K        L
              1      1.46    1.38     1.33    1.21    1.37    1.41    1.54     1.27    1.75    1.57    1.47     1.44
              4      -0.58   -0.73   -0.83    -0.96   -0.76   -0.87   -1.11   -1.23    -0.9    -1.11   -2.26   -3.32
              8      -1.67   -1.94   -2.06    -2.31   -1.97   -2.69   -2.69    -2.9    -5.67   -6.47   -7.03   -8.57
              12     -2.58   -2.98   -3.56    -3.99   -3.73   -4.14   -4.72    -5.3   -11.88   -12.8   -13.96  -15.65
              24     -7.41   -8.35   -8.93    -9.89  -10.09   -11.16  -12.46  -13.67  -21.97  -23.03   -24.22  -25.36
              36     -10.68  -11.52  -11.97  -12.66  -14.55   -15.61  -16.63  -17.78  -24.58  -26.23   -28.15  -29.89
              52     -11.68  -12.46  -13.08  -13.54  -15.46   -16.56  -17.68  -18.58  -26.26  -28.06   -29.94  -31.28

           Table 6: Average weight loss for various exposure periods of sulphate attack
                                                             WEIGHT LOSS (%)
            WEEKS                GPCT                             GPCA                              CC
                      A       B        C       D       E       F       G        H       I       J       K        L
              1      1.62    1.54     1.47    1.52    1.57     1.5     1.51    1.48    1.36     1.5    1.56     1.55
              4      1.91    1.83     1.83    1.85    2.01    2.05     2.08    2.1     1.52     1.8    1.85     1.83
              8      1.95    1.93     1.89    1.99    2.12    2.15     2.17    2.19    1.22    1.55    0.75     0.52
              12     1.97     1.95    1.88    1.94    1.69    1.63     1.55    1.54    0.62    0.68    -0.81   -1.12
              24     1.38     0.99    1.00    0.89    0.97    0.42     0.26    0.04    -1.29   -2.39   -4.94   -5.56
              36     0.75     0.15    0.04    -0.16   0.11    -0.68   -1.15   -1.48    -3.4    -5.72   -8.57   -9.85
              52     -0.46   -0.91   -0.93    -1.07   -1.29   -2.23   -3.07   -3.64    -5.97  -10.06   -13.14  -15.09

               5                                                      5
               0                                                      0
                0              20             40             60      -5  0    10      20     30      40     50      60
              -5
            Weight loss (%)  -10                                   Weight loss (%)  -10

              -15
                                                                     -15
              -20                                                    -20
              -25                                                    -25
              -30                                                    -30
                            Exposure periods (Weeks)                              Exposure periods (Weeks)
                       A-A            A-E            A-I                      A-B            A-F            A-J
                       S-A            S-E            S-I                      S-B            S-F            S-J
           Figure 6: Variation of weight loss due to acid and sulphate attack of mix   Figure 7: Variation of weight loss due to acid and sulphate attack of mix
                                 A, E and I                                             B, F and J
               5                                                      5
               0                                                      0
                0      10      20     30      40     50      60      -5  0    10      20     30      40     50     60
              -5
            Weight loss (%)  -10                                   Weight loss (%)  -10
                                                                    -15
              -15
              -20                                                   -20
                                                                    -25
              -25                                                   -30
              -30                                                   -35
                            Exposure periods (Weeks)                              Exposure periods (Weeks)
                       A-C            A-G            A-K                      A-D            A-H            A-L
                       S-C            S-G            S-K                      S-D            S-H            S-L
           Figure 8: Variation of weight loss due to acid and sulphate attack of mix   Figure 9: Variation of weight loss due to acid and sulphate attack of mix
                                 C, G and K                                             D, H and L


                                                                           THE INDIAN CONCRETE JOURNAL | FEBRUARY 2026  73
   4   5   6   7   8   9   10   11   12   13   14